. 2016 Oct;172(2):889-900.
doi: 10.1104/pp.16.00965. Epub 2016 Aug 9.

ORM Expression Alters Sphingolipid Homeostasis and Differentially Affects Ceramide Synthase Activity

Affiliations

ORM Expression Alters Sphingolipid Homeostasis and Differentially Affects Ceramide Synthase Activity

Athen N Kimberlin et al. Plant Physiol. 2016 Oct.

Abstract

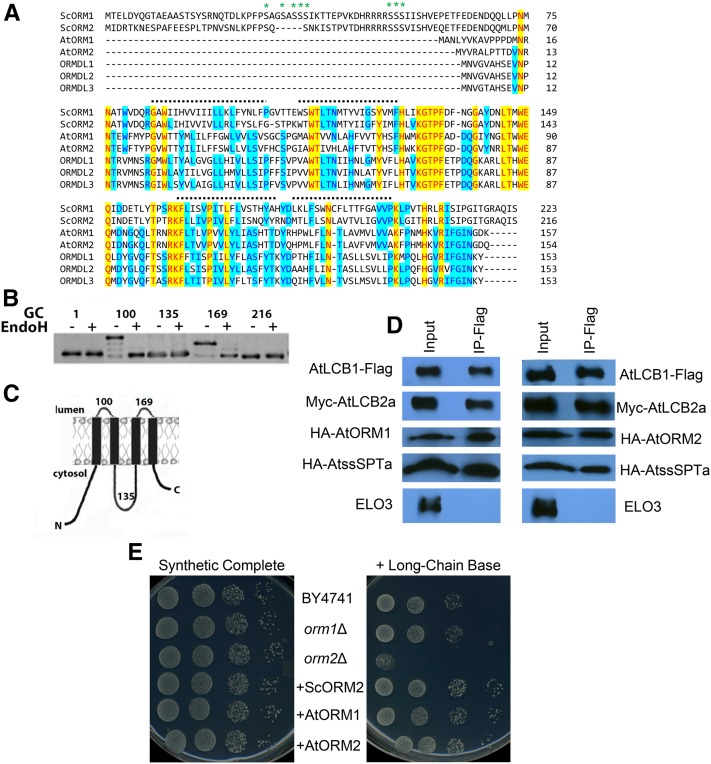
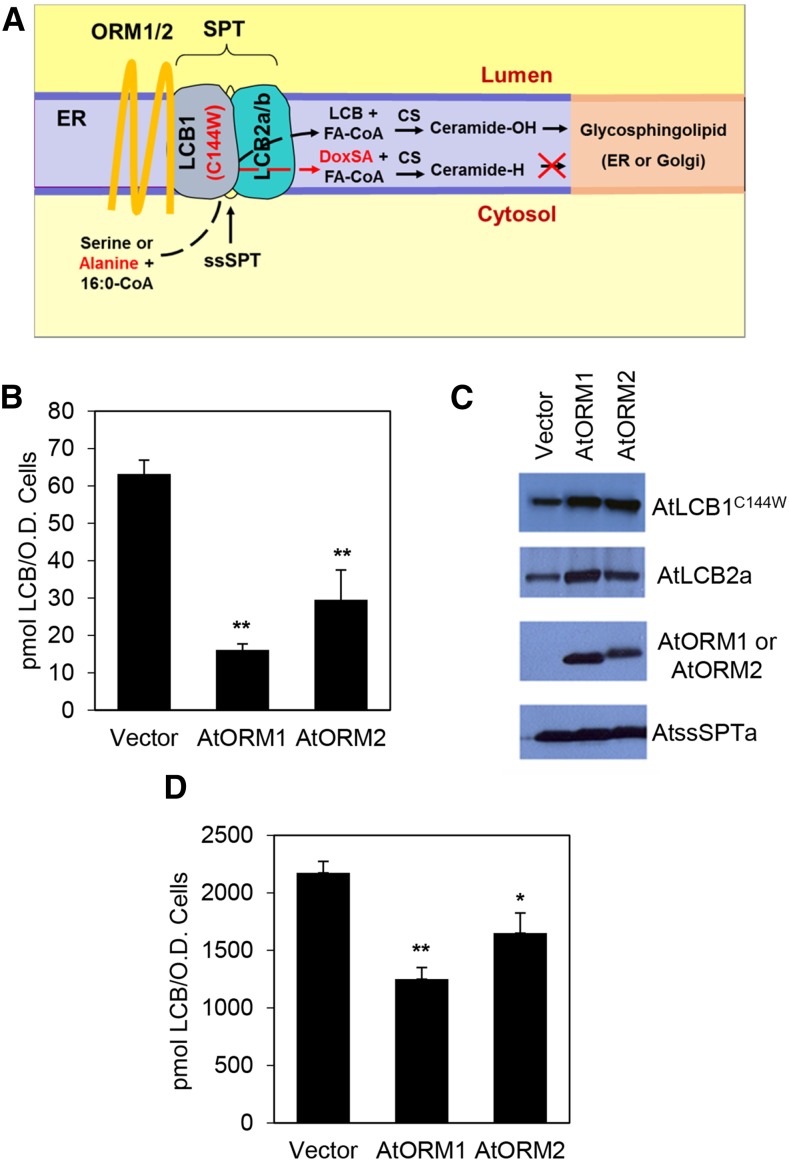
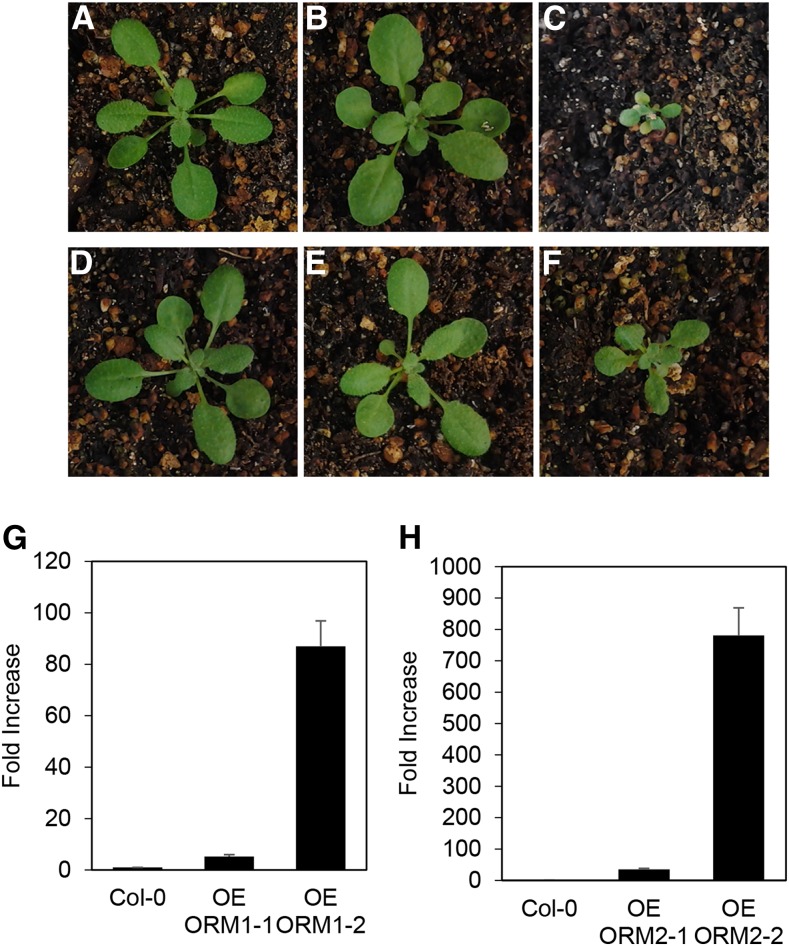
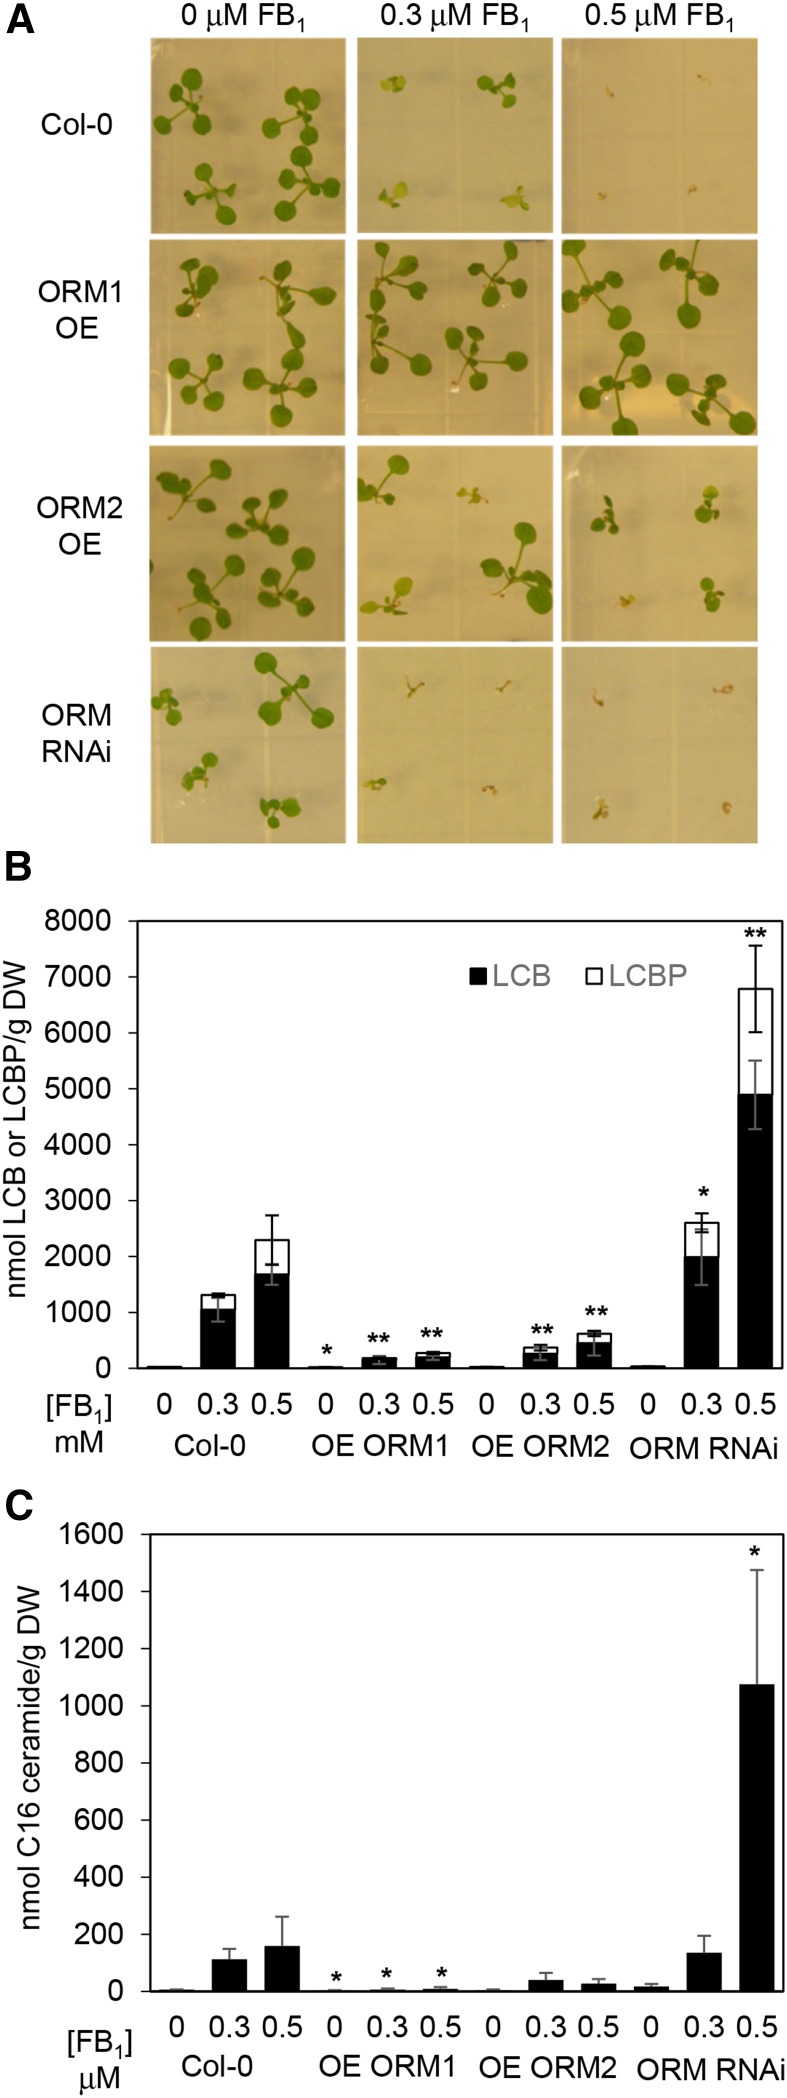
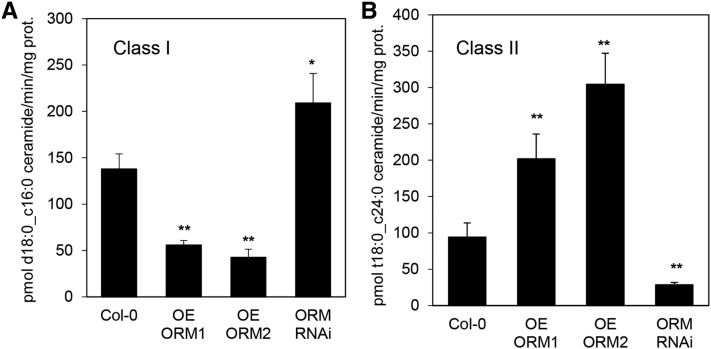
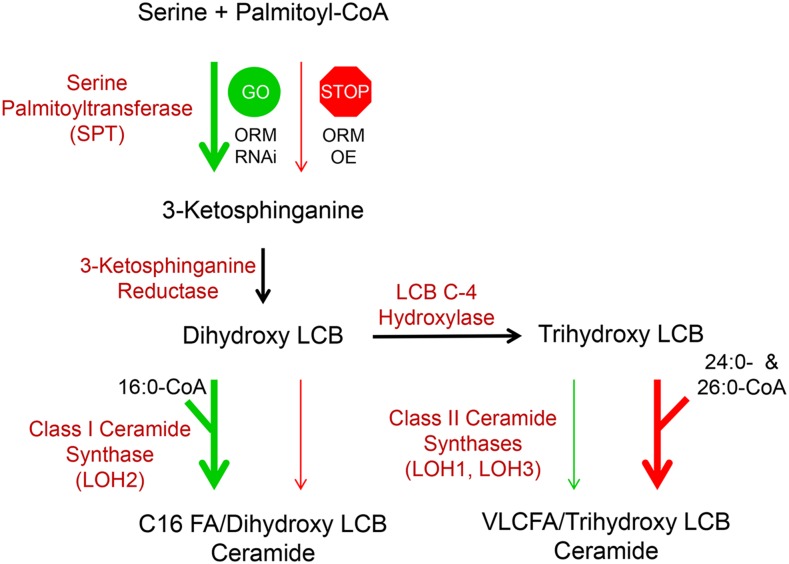
Sphingolipid synthesis is tightly regulated in eukaryotes. This regulation in plants ensures sufficient sphingolipids to support growth while limiting the accumulation of sphingolipid metabolites that induce programmed cell death. Serine palmitoyltransferase (SPT) catalyzes the first step in sphingolipid biosynthesis and is considered the primary sphingolipid homeostatic regulatory point. In this report, Arabidopsis (Arabidopsis thaliana) putative SPT regulatory proteins, orosomucoid-like proteins AtORM1 and AtORM2, were found to interact physically with Arabidopsis SPT and to suppress SPT activity when coexpressed with Arabidopsis SPT subunits long-chain base1 (LCB1) and LCB2 and the small subunit of SPT in a yeast (Saccharomyces cerevisiae) SPT-deficient mutant. Consistent with a role in SPT suppression, AtORM1 and AtORM2 overexpression lines displayed increased resistance to the programmed cell death-inducing mycotoxin fumonisin B1, with an accompanying reduced accumulation of LCBs and C16 fatty acid-containing ceramides relative to wild-type plants. Conversely, RNA interference (RNAi) suppression lines of AtORM1 and AtORM2 displayed increased sensitivity to fumonisin B1 and an accompanying strong increase in LCBs and C16 fatty acid-containing ceramides relative to wild-type plants. Overexpression lines also were found to have reduced activity of the class I ceramide synthase that uses C16 fatty acid acyl-coenzyme A and dihydroxy LCB substrates but increased activity of class II ceramide synthases that use very-long-chain fatty acyl-coenzyme A and trihydroxy LCB substrates. RNAi suppression lines, in contrast, displayed increased class I ceramide synthase activity but reduced class II ceramide synthase activity. These findings indicate that ORM mediation of SPT activity differentially regulates functionally distinct ceramide synthase activities as part of a broader sphingolipid homeostatic regulatory network.


Figures

Figure 1.
Figure 1.
Arabidopsis ORMs interact physically with the Arabidopsis core SPT components and complement an S. cerevisiae ORM2 knockout mutant. A, Amino acid sequence alignment for ORM polypeptides from S. cerevisiae (ScORM1 and ScORM2), Arabidopsis (AtORM1 and AtORM2), and Homo sapiens (ORMDL1, ORMDL2, and ORMDL3). The alignments show the N-terminal extension, found only in yeast, responsible for the reversible phosphorylation (at residues marked with asterisks) that modulates SPT activity (Breslow et al., 2010). The dotted lines mark the positions of four potential transmembrane domains identified by hydropathy analyses. B, Topology mapping of ScORM2. GCs were inserted after the indicated amino acids, and the GC-tagged proteins were expressed in yeast. Increased mobility following treatment of microsomes with endoglycosidase H (EndoH) revealed that the GCs at residues 100 and 169 are glycosylated and, therefore, reside in the lumen of the endoplasmic reticulum (ER). C, Model of ORM protein topology. The figure shows the experimentally determined membrane topology of ScORM2 as shown in B. D, Coimmunoprecipitation of FLAG-tagged AtLCB1 in yeast expressing AtLCB1-FLAG, AtLCB2a-Myc, AtssSPTa-HA, and either AtORM1-HA or AtORM2-HA. Solubilized yeast microsomes were incubated with anti-FLAG beads, and protein was eluted with FLAG peptide. Solubilized microsomes (Input) and the eluent (IP-Flag) were analyzed by SDS-PAGE, and the polypeptides were detected by immunoblotting. ELO3 was used as a negative control. E, AtORM1 and AtORM2 complement the sensitivity of the S. cerevisiae orm2Δ mutant to exogenous LCBs. Shown are plates containing synthetic complete medium lacking or supplemented with the LCB phytosphingosine at a concentration of 15 µm. As shown, plates contain dilutions of the parental cell line BY4741, S. cerevisiae orm1Δ mutant, S. cerevisiae orm2Δ mutant, and S. cerevisiae orm2Δ complemented with the wild-type copy of the S. cerevisiae ORM2 (+ScORM2), AtORM1 (+AtORM1), or AtORM2 (+AtORM2).
Figure 2.
Figure 2.
AtORM1 and AtORM2 are negative regulators of SPT activity. A, Schematic representation of the core SPT complex consisting of AtLCB1, AtLCB2a/b, AtssSPT, and AtORM. The complex resides in the ER membrane and catalyzes a condensation reaction between Ser and palmitoyl-CoA to produce LCB. The C144W (HSAN1) mutation in AtLCB1 allows SPT to use Ala as well as Ser as a substrate. The deoxy-LCB produced with Ala is referred to as DoxSA and lacks the hydroxyl group that is needed for LCB degradation and for conversion to the glycosphingolipid GlcCer in the ER or GIPC in the Golgi. B, In vivo AtSPT activity was measured in a yeast mutant that lacks endogenous SPT. Cells expressing AtLCB1C144W, AtLCB2a, or AtssSPTa with or without AtORM1 or AtORM2 were used to demonstrate an inhibitory effect on SPT activity. The activity is measured by the accumulation of DoxSA, produced by the AtLCB1C144W-containing mutant SPT enzyme. The DoxSA product is not produced naturally and is not degraded. Values shown are averages of three independent assays ± sd. **, P < 0.01. C, Immunoblot of yeast microsomes expressing AtLCB1C144W-FLAG, AtLCB2a-Myc, AtORM1/2-HA, and AtssSPTa-HA. Anti-FLAG, anti-Myc, and anti-HA antibodies were used for detection. The results show that the C144W mutation in AtLCB1 does not affect the interaction of SPT components and interacting proteins. D, In vivo AtSPT activity measured in cells of yeast lacking endogenous SPT but expressing AtLCB1, AtLCB2a, AtssSPTa (Vector), and either AtORM1 or AtORM2. The activity is measured through the accumulation of total LCB produced. Values shown are averages of three independent assays ± sd. *, P < 0.05; and **, P < 0.01.
Figure 3.
Figure 3.
Subcellular localization of AtORM1 and AtORM2 polypeptides, and gene expression of AtORM1 and AtORM2 in Arabidopsis. A to F, Subcellular localization of AtORM1-YFP or AtORM2-YFP fusion coexpressed with the ER marker mCherry fusion construct. All constructs were transiently expressed in N. benthamiana through Agrobacterium tumefaciens infiltration and viewed by confocal microscopy. Green color in A and D shows AtORM1 and AtORM2 localization, respectively. The red color in B and E indicates ER marker localization. The yellow color seen in C and F indicates the colocalization of AtORM1 and AtORM2 polypeptides, respectively, with the ER marker. G, Relative expression of AtORM1 and AtORM2. Tissues were collected from wild-type Columbia-0 (Col-0), and quantitative PCR (qPCR) was used to determine AtORM1 and AtORM2 transcript levels. Protein phosphatase 2A subunit A3 (PP2AA3) was used as a reference gene. Values shown are means ± sd for three independent measurements and indicate relative fold increase of AtORM1 or AtORM2 compared with AtORM2 or AtORM1, respectively. H to Q, AtORM1 and AtORM2 promoter::GUS expression analysis. An approximately 1-kb region upstream of the AtORM1 (H–L) or AtORM2 (M–Q) start codon was fused to the GUS gene and analyzed for expression in various organs and tissues as described previously (Jefferson et al., 1987). The arrow in H indicates the expression of AtORM1 in developing embryos inside immature siliques.
Figure 4.
Figure 4.
Phenotypes associated with AtORM1 and AtORM2 overexpression. A to F, High levels of AtORM1 and AtORM2 expression result in reduced plant size, early leaf senescence, and early plant death. Representative images of plants grown under the same conditions and of comparable age are shown. The wild type (Col-0) is shown in A and D. AtORM1 overexpression line 1 (OE ORM1-1) is shown in B, while AtORM2 overexpression line 1 (OE ORM2-1) is shown in E. AtORM1 overexpression line 2 (OE ORM1-2) is shown in C, while AtORM2 overexpression line 2 (OE ORM2-2) is shown in F. The phenotype correlates with ORM expression level, as lines with the strongest overexpression display a phenotype while relatively weaker overexpression lines do not show a noticeable growth phenotype. G and H, Expression levels of AtORM1 (G) and AtORM2 (H) in overexpressing lines (OE). Tissue was collected from wild-type Col-0 and lines overexpressing AtORM1 and AtORM2 grown under standard conditions. qPCR was used to determine relative AtORM1 and AtORM2 transcript levels by comparison with Col-0. PP2AA3 was used as a reference gene. Values shown are means ± sd for three independent measurements and indicate relative fold increase of AtORM1 or AtORM2 compared with wild-type levels.
Figure 5.
Figure 5.
Modulation of AtORM1 and AtORM2 expression alters sensitivity to FB1 and LCB as well as C16 ceramide accumulation. A, Altered AtORM1 and AtORM2 expression affects the sensitivity of plants to FB1, a competitive inhibitor of ceramide synthase. Seeds were sown on Linsmaier and Skoog (LS) agar plates supplemented with FB1 at 0.3 and 0.5 μm as indicated. The wild type (Col-0) is extremely sensitive to FB1 at 0.5 μm and less affected at 0.3 μm. Up-regulation of AtORM1 (ORM1) and AtORM2 (ORM2) by transgenic overexpression (OE) causes an FB1-resistant phenotype, whereas RNAi suppression of AtORM by RNAi causes an FB1-sensitive phenotype (ORM RNAi). Images were taken 14 d after seeds were sown and are representative of three independent experiments. B, Altered AtORM1 and AtORM2 affects the accumulation of cytotoxic free LCB and LCB phosphate (LCBP) levels in response to FB1 treatment. Wild-type plants show increased total LCB levels when treated with FB1. Compared with the wild type, AtORM1 and AtORM2 overexpression plants display FB1 resistance and reduced total LCB level. Alternatively, AtORM RNAi suppression plants display FB1 sensitivity and increased total LCB level. Electrospray ionization-tandem mass spectrometry analyses were performed with three independent biological replicates ± sd. Plants were grown on LS plates ± FB1 for 2 weeks before tissue collection. DW, Dry weight. *, P < 0.05; and **, P < 0.01. C, Total C16 ceramide levels are affected by the modulation of AtORM expression. AtORM1 overexpression plants show decreased accumulation of C16 ceramide when compared with wild-type plants comparatively grown on LS plates ± FB1, while ORM RNAi plants show increased accumulation of C16 ceramide. Analyses were performed as described in B with three independent biological replicates ± sd. *, P < 0.05.
Figure 6.
Figure 6.
Ceramide synthase activity is altered by the modulation of AtORM1 and AtORM2 expression. A, Altered AtORM1 and AtORM2 expression affects class I ceramide synthase activity. Class I ceramide synthase activity was assayed on microsomal protein prepared from hydroponically grown root tissue using 16:0-CoA and d18:0 as substrates. Increases in AtORM1 and AtORM2 overexpression (OE ORM1, OE ORM2) resulted in decreases in class I ceramide synthase activity, while RNAi suppression of AtORM (ORM RNAi) resulted in an increase in activity of this enzyme. Analyses were performed with three independent biological replicates ± sd. *, P < 0.05; and **, P < 0.01. B, Increases in AtORM1 (OE ORM1) and AtORM2 (OE ORM2) expression resulted in increases in class II ceramide synthase activity, while RNAi suppression of AtORM resulted in a decrease in activity of this enzyme class. Activity assays were conducted with microsomes from hydroponically grown root tissue using 24:0-CoA and t18:0 substrates. Analyses were performed with three independent biological replicates ± sd. **, P < 0.01.
Figure 7.
Figure 7.
Model of the coordinated regulation of sphingolipid synthesis by AtORM1 and AtORM2 and ceramide synthase activity. The model represents the core synthesis pathway of ceramides in Arabidopsis. SPT catalyzes a condensation reaction between Ser and palmitoyl-CoA, leading to the production of 3-ketosphinganine, which is reduced to dihydroxy LCB (d18:0) through 3-ketosphinganine reductase activity. Dihydroxy LCBs can be used by class I ceramide synthase (LOH2) along with 16:0-CoA to produce C16 ceramides. Alternatively, dihydroxy LCBs can be hydroxylated by LCB C-4 hydroxylase to form trihydroxy LCBs (t18:0) that are used by class II ceramide synthases (LOH1 and LOH3) along with very long-chain fatty acyl-CoAs, primarily 24:0- and 26:0-CoA, to produce ceramides containing VLCFAs. In the model shown, modulation of AtORM expression leads to alterations in ceramide synthase activity. AtORM RNAi suppression, indicated by GO, results in increased SPT activity and increased generation of LCBs, with a concomitant increase in class I activity and a decrease in class II activity. Conversely, overexpression (OE) of AtORM1 and AtORM2, indicated by STOP, results in decreased SPT activity and reduced LCB generation, with a concomitant decrease in class I activity and an increase in class II activity to ensure the production of sufficient levels of ceramides with VLCFAs to support growth. A role of LCB C-4 hydroxylase activity in mediating relative flux through class I and II ceramide synthases, particularly in response to enhanced LCB synthesis, also is possible.

References

    1. Bach L, Gissot L, Marion J, Tellier F, Moreau P, Satiat-Jeunemaître B, Palauqui JC, Napier JA, Faure JD (2011) Very-long-chain fatty acids are required for cell plate formation during cytokinesis in Arabidopsis thaliana. J Cell Sci 124: 3223–3234 - PubMed
    1. Bach L, Michaelson LV, Haslam R, Bellec Y, Gissot L, Marion J, Da Costa M, Boutin JP, Miquel M, Tellier F, et al. (2008) The very-long-chain hydroxy fatty acyl-CoA dehydratase PASTICCINO2 is essential and limiting for plant development. Proc Natl Acad Sci USA 105: 14727–14731 - PMC - PubMed
    1. Bayer EM, Mongrand S, Tilsner J (2014) Specialized membrane domains of plasmodesmata, plant intercellular nanopores. Front Plant Sci 5: 507. - PMC - PubMed
    1. Bi FC, Liu Z, Wu JX, Liang H, Xi XL, Fang C, Sun TJ, Yin J, Dai GY, Rong C, et al. (2014) Loss of ceramide kinase in Arabidopsis impairs defenses and promotes ceramide accumulation and mitochondrial H2O2 bursts. Plant Cell 26: 3449–3467 - PMC - PubMed
    1. Breslow DK. (2013) Sphingolipid homeostasis in the endoplasmic reticulum and beyond. Cold Spring Harb Perspect Biol 5: a013326. - PMC - PubMed

Publication types

MeSH terms

LinkOut - more resources