. 2016 Aug 16;113(33):9162-70.
doi: 10.1073/pnas.1610805113. Epub 2016 Aug 9.

Lyme disease and relapsing fever Borrelia elongate through zones of peptidoglycan synthesis that mark division sites of daughter cells

Affiliations

Lyme disease and relapsing fever Borrelia elongate through zones of peptidoglycan synthesis that mark division sites of daughter cells

Brandon Lyon Jutras et al. Proc Natl Acad Sci U S A. .

Abstract

Agents that cause Lyme disease, relapsing fever, leptospirosis, and syphilis belong to the phylum Spirochaetae-a unique lineage of bacteria most known for their long, spiral morphology. Despite the relevance to human health, little is known about the most fundamental aspects of spirochete growth. Here, using quantitative microscopy to track peptidoglycan cell-wall synthesis, we found that the Lyme disease spirochete Borrelia burgdorferi displays a complex pattern of growth. B. burgdorferi elongates from discrete zones that are both spatially and temporally regulated. In addition, some peptidoglycan incorporation occurs along the cell body, with the notable exception of a large region at the poles. Newborn cells inherit a highly active zone of peptidoglycan synthesis at midcell that contributes to elongation for most of the cell cycle. Concomitant with the initiation of nucleoid separation and cell constriction, second and third zones of elongation are established at the 1/4 and 3/4 cellular positions, marking future sites of division for the subsequent generation. Positioning of elongation zones along the cell is robust to cell length variations and is relatively precise over long distances (>30 µm), suggesting that cells ‟sense" relative, as opposed to absolute, cell length to establish zones of peptidoglycan synthesis. The transition from one to three zones of peptidoglycan growth during the cell cycle is also observed in relapsing fever Borrelia. However, this mode of growth does not extend to representative species from other spirochetal genera, suggesting that this distinctive growth mode represents an evolutionary divide in the spirochete phylum.

Keywords: Borrelia burgdorferi; Lyme disease; peptidoglycan; relapsing fever; spirochetes.


Conflict of interest statement

The authors declare no conflict of interest. See QnAs on page 9129.

Figures

Fig. 1.
Fig. 1.
Complex pattern of HADA incorporation into B. burgdorferi PG. (A) Phase-contrast and fluorescence micrographs of live B. burgdorferi B31 MI cells labeled with 0.1 mM HADA for 1 h. (B) Example of a HADA-labeled cell. (C) Fluorescence micrographs of a PG sacculus purified from HADA-labeled cells. The PG sacculus was identified by immunofluorescence staining with anti-PG antibodies (Left). (D) Fluorescence line scans of anti-PG antibody and HADA signals from the purified PG sacculus shown in C. (E) Micrographs of B. burgdorferi B31 MI cells incubated with 1% DMSO, 0.1 mM HADA alone (HADA), 0.1 mM HADA and 100 μg/mL MurE ligase inhibitor d-cycloserine (HADA + DCS), or 0.1 mM HADA and 5 mM d-alanine (HADA + d-Ala).
Fig. S1.
Fig. S1.
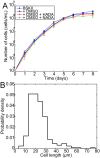
Growth rate and cell length distribution of B. burgdorferi type strain B31 MI. (A) Replication rate of B. burgdorferi B31 MI in the presence of 1% DMSO diluent (black), 0.1 mM HADA (red), or 0.2 mM NADA (green) diluted in 1% DMSO (final concentration). (B) Histogram of the cell length distribution for cells in midlog exponential growth phase. B. burgdorferi B31 MI cells were imaged by phase-contrast microscopy and the length of individual cells was determined using the Oufti software package (49).
Fig. S2.
Fig. S2.
B. burgdorferi B31 MI PG labeling and control experiments. (A) Phase-contrast and corresponding fluorescence images of B. burgdorferi B31 MI cells incubated with 0.1 mM HADA for 4 h. The arrows show HADA signal at a single pole. (B) Representative images of B. burgdorferi B31 MI cells in midlog exponential growth phase incubated with 0.2 mM NADA for 1 h and imaged by phase-contrast and epifluorescence microscopy. (C) Histograms showing a population analysis of the normalized fluorescent signal intensity generated by the medium + DMSO (DMSO, n = 348), HADA alone (n = 462), HADA + DCS (n = 304), and HADA + d-Ala (n = 275).
Fig. S3.
Fig. S3.
Identification of HADA-labeled monomeric muropeptides by liquid chromatography and mass spectrometry. (A) Ion chromatogram trace for all detected ions (i and ii) or (B) the ion at m/z = 607.24 (iii and iv) in PG digest of the HADA-labeled PG (i and iii) or DMSO control sample (ii and iv), showing that the ion at m/z = 607.24 is present in the HADA-labeled sample and not in the control. The red box corresponds to the muropeptide species containing HADA. (C) The deconvolved neutral mass and isotope distribution of the doubly charged ion (Deconvolved) is virtually identical to the mass spectrum using the chemical formula C50H72N10O25 (Simulated), confirming highly accurate agreement in mass between the predicted and experimentally measured values for the HADA-labeled muropeptide.
Fig. 2.
Fig. 2.
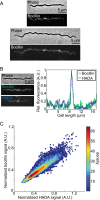
Colocalization of HADA and fluorescent PBP analog bocillin. (A) Micrographs of B. burgdorferi B31 MI incubated for 30 min with 1.5 μg/mL of bocillin alone. (B) Representative micrograph and corresponding fluorescence profile of a cell colabeled with 1.5 μg/mL of bocillin and 40 μM of HADA. (C) Correlation analysis of HADA and bocillin signals. HADA and bocillin fluorescence intensities were normalized on a single-cell basis and compared (n = 286 cells, r = 0.96). The color map indicates density of plotted correlations.
Fig. S4.
Fig. S4.
In vitro and in vivo labeling of B. burgdorferi B31 MI PBPs with bocillin. (A) Cell membrane extracts were incubated with 10 μg/mL of bocillin alone (lane 1) or 10 μg/mL bocillin and 8, 40, and 80 µM cephalexin (lanes 2–4). Reactions were separated by SDS/PAGE and exposed to UV for visualization. (B) Cephalexin competition was quantified densitometrically by determining the amount of bound bocillin relative to no competitor (lane 1 in A). Mean percent bound/unbound and SD values were calculated based on three independent experiments. (C) Cells were incubated for 15 min with bocillin (2.0 µg/mL) with or without 36 μM cephalexin and imaged by phase-contrast and epifluorescence microscopy. (D) Population-level analysis of the experiment described in C. Histogram of total fluorescence signal per cell from cells treated with bocillin alone (n = 182) or treated with bocillin and cephalexin (n = 302), normalized by cell area. (E) Cells were labeled with 1.5 µg/mL of bocillin for 30 min and imaged using the filter cubes specific for HADA and bocillin detection. Shown is the image from the HADA channel scaled to the same contrast as in Fig. 2, as well as scaled with an increased contrast to show minimal bleed-through of the bocillin signal into the HADA channel. (F) Cells were labeled with 40 µM HADA for 30 min and imaged using the filter cubes specific for HADA and bocillin detection. A representative field of view is shown in phase contrast and the HADA channel. The bocillin channel is also shown, scaled as in Fig. 2 or with an increased contrast.
Fig. 3.
Fig. 3.
Population analysis of HADA signal during the B. burgdorferi cell cycle. (A) Demograph analysis of HADA fluorescence profiles in which all B31 MI cells in the population (n = 276) were organized in ascending cell length order (left to right). The heat map displays the relative fluorescence in arbitrary units (0–1). Representative fluorescence images of cells (I, II, and III) at different points of the cell cycle (dashed arrows) are depicted on the right with cell boundaries in yellow. (B) Scatter plot showing the positions of HADA zone positions as a function of cell length. (C) Same as in B, except that zone positions were plotted in cellular coordinates.
Fig. S5.
Fig. S5.
Multiple zone pattern of PG synthesis remains apparent with short HADA incubation times. B. burgdorferi B31 MI cells were incubated with 0.1 mM HADA for 15 min. Analyses were performed on the same dataset (n = 299 cells). (A) Demograph of fluorescence profiles for all cells in the population, organized in ascending cell length order (left to right). Heat map displays the fluorescence intensity in arbitrary units (0–1). Representative fluorescence images of cells (I, II, III) at different points of the cell cycle (dashed arrows) are depicted on the right. Cell boundaries (green) were determined from corresponding phase-contrast images by Oufti. (B) Scatter plot showing the positions of HADA zones as a function of cell length. (C) Same as in B, but with zone positions plotted in cellular coordinates.
Fig. 4.
Fig. 4.
Zones of PG synthesis are sites of elongation that mark future division sites. (A) B. burgdorferi Bb914 cells, which constitutively express GFP, were incubated for 4 h with 0.1 mM HADA and imaged before and after repeated laser photobleaching. A relatively short (21.7-µm) cell with a single HADA zone at midcell (early cell-cycle stage) is shown. The yellow oval shows the photobleaching region. (B) Same as in A, but showing a comparatively longer (33.9-µm) cell with 1/4 and 3/4 HADA zones, in addition to a fading midcell zone (late stage of cell cycle). (C) Ensemble (Left) and single-cell (Right) profiles of free cytoplasmic GFP (green), DRAQ5 DNA stain (red), HADA (blue), and phase-contrast (black) for B. burgdorferi strain Bb914 cells were plotted relative to midcell to track progression of cytoplasmic membrane fusion, nucleoid separation, and cell envelope separation relative to PG zone establishment. Fluorescence and phase-contrast intensities were normalized and plotted in arbitrary units (A.U.). Mean cell length (<L>) for each ensemble was displayed for ensemble profiles, and length (L) was displayed for single-cell profiles. Only cell bins displaying major cell-cycle events are shown. All profile ensembles are shown in Fig. S6B. (D) B. burgdorferi B31 MI cells were pulse-labeled for 1 h with 0.2 mM NADA (green) then chased with 0.1 mM HADA (red) for 1 h before imaging. Fluorescence profiles of zoomed regions depict the amount of overlap between signals.
Fig. S6.
Fig. S6.
DNA staining and timing of growth zone establishment relative to cell-cycle events. (A) Representative micrographs of midlog exponential B. burgdorferi Bb914 cells that express free cytoplasmic GFP. Cells were labeled with 0.1 mM HADA and 0.5 μM of the DNA stain DRAQ5. (B) Ensemble profiles of free cytoplasmic GFP (green), DRAQ5 DNA stain (red), HADA (blue), and phase-contrast (black) for B. burgdorferi strain Bb914 cells were plotted relative to midcell to track progression of cytoplasmic membrane fusion, nucleoid separation, and cell envelope separation relative to PG zone establishment. Fluorescence and phase-contrast intensities were normalized and plotted in arbitrary units (A.U.). Mean cell length (<L>) is displayed for each ensemble group.
Fig. S7.
Fig. S7.
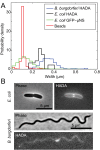
Estimation of zone size of PG synthesis. To assess whether the zones of PG synthesis in B. burgdorferi were larger than the diffraction limit of our microscope setup, we determined the widths of fits to various fluorescent signals. (A) Comparison of widths of fits to B. burgdorferi HADA signal (n = 299) relative to fluorescent signal from HADA at midcell in E. coli (n = 86), diffraction-limited GFP-µNS particles (n = 23,451), and 100-nm fluorescent beads (n = 1,014). (B) Phase-contrast and epifluorescence images of a constricting E. coli MG1655 cell labeled with 1 mM HADA for 3 min and of a B. burgdorferi B31 MI cell labeled with 0.1 mM HADA for 15 min.
Fig. 5.
Fig. 5.
Strains of B. burgdorferi exhibit a similar pattern of PG synthesis. (A) Scatter plot of the relative position of HADA zones as a function of cell length for various strains of B. burgdorferi. Only cells with three zones are plotted. Analysis was performed on B31 MI (n = 33), variant clones e2 (n = 95) and A3 (n = 21), and an A3 mutant lacking flagellar gene flaB (A3ΔflaB, n = 18). B31 derivatives were compared with clones of the human isolate 297 (n = 20) and tick isolate N40 (n = 24), as well as the strain Bb914 (n = 30). Probability distributions of plotted data are also shown. (B) Bar graphs depicting the percent of cells with a given number of zones.
Fig. S8.
Fig. S8.
Relative zone position of PG synthesis in different B. burgdorferi strains. Different B. burgdorferi strains were propagated to midlog growth phase and imaged by phase-contrast microscopy. (A) Single-cell length measurements were determined using Oufti. The distribution of cell lengths is shown with a violin plot where each dot represents a single cell. The mean (black dot) and SD (bars) are displayed. (BG) Individual scatter plots depicting the relative HADA zone position of all B. burgdorferi strains analyzed. (B) B31 clone e2 (n = 589), (C) B31 A3 (n = 1,136), (D) A3ΔflaB (n = 70), (E) B. burgdorferi 297 (n = 1,038), (F) B. burgdorferi Bb914 (n = 312), and (G) B. burgdorferi N40 (n = 669).
Fig. 6.
Fig. 6.
A phylogenetic split in spirochete mode of growth. (AD) Cultures of spirochetes from different genera were incubated with variable concentrations of HADA for 30 min and analyzed at the single-cell level in a demograph. Heat map displays the relative fluorescence intensity in arbitrary units (0–1). (A) Borrelia miyamotoi strain LS-2000, 0.1 mM HADA, n = 173. (B) B. hermsii, 0.1 mM HADA, n = 391. (C) T. denticola ATCC 34505, 0.2 mM HADA, n = 2132. (D) L. interrogans serovar Conpenhageni strain Fiocruz L1-130, 0.4 mM HADA, n = 373. (E) Bar graphs depicting the percent of cells with a given number of zones.
Fig. S9.
Fig. S9.
Pattern of PG synthesis varies among spirochetes. (A) Cells from different species and genera of spirochetes were incubated for 30 min with HADA or (B) coincubated with HADA and d-cycloserine (DCS) before imaging by phase-contrast and epifluorescence microscopy. B. hermsii and B. miyamotoi (0.1 mM HADA and 100 μg/mL DCS), T. denticola (0.2 mM HADA and 100 μg/mL DCS), and L. interrogans (0.4 mM HADA and 150 μg/mL DCS). Fluorescence images in A and B were scaled the same for comparison. (Scale bars, 5 μm.)
Fig. S10.
Fig. S10.
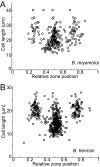
Relative zone position in relapsing fever spirochetes. (A) B. miyamotoi (n = 173) and (B) B. hermsii (n = 391) cells were incubated with 0.1 mM HADA for 30 min. Plots show the HADA-labeled zone position in relative cellular coordinates.
Fig. S11.
Fig. S11.
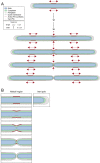
Model for PG synthesis during the cell cycle of Borrelia species. (A) Borrelia cells are born synthesizing new PG along the majority of the cell length with a single highly active zone of elongation at midcell (red). The polar regions are largely inert. Cells display this pattern of growth for most of the cell cycle (dashed black arrows) and then establish new highly active zones of PG elongation at the 1/4 and 3/4 positions. Concomitant with the establishment of new active zones of PG synthesis, cells initiate nucleoid separation and envelope constriction. At about the same time, septal PG synthesis initiates. The asterisk indicates that we do not know whether cell elongation at midcell continues during septum formation. The 1/4 and 3/4 positions of PG elongation, established before complete DNA segregation, septation, and envelope constriction, will become the zone of midcell elongation and future division sites for the daughter cells. (B) Enlarged view of the midcell region showing the progression of cell division over the cell cycle. Also shown is the polar region, which is largely inert throughout the cell cycle, because no further PG synthesis seems to occur after septation.
Fig. S12.
Fig. S12.
Chemical synthesis of NADA ((R)-2-amino-3-((7-nitrobenzo[c][1,2,5]oxadiazol-4-yl)amino) propanoic acid hydrochloride). Chemical reactants and intermediates formed during the synthesis of NADA. Compound 1 is (R)-3-amino-2-((tert-butoxycarbonyl)amino)propanoic acid. Compound 2 is 4-chloro-7-nitrobenzo [c][1,2,5] oxadiazole. Compound 3 is (R)-2-((tert-butoxycarbonyl)amino)-3-((7-nitrobenzo[c][1,2,5] oxadiazol-4-yl)amino). Compound 4 is the final product NADA.
Fig. S13.
Fig. S13.
HADA labeling does not affect spirochete replication rate. Growth conditions included media (blue), supplemented with 1% DMSO diluent (black), or media with 1% DMSO diluent (final concentration) plus variable concentrations of HADA (red). The replication rate of T. denticola (A) was measured spectrophotometrically by optical density (660 nm), whereas the replication rate of L. interrogans (B), B. hermsii (C), and B. miyamotoi (D) was enumerated manually and reported as the average of three measurements (± SD).

References

    1. Centers for Disease Control and Prevention 2013 CDC provides estimate of Americans diagnosed with Lyme disease each year. Available at www.cdc.gov/media/releases/2013/p0819-lyme-disease.html. Accessed February 17, 2016.
    1. Mead PS. Epidemiology of Lyme disease. Infect Dis Clin North Am. 2015;29(2):187–210. - PubMed
    1. Benach JL, et al. In: Borrelia: Molecular Biology, Host Interaction and Pathogenesis. Samuels DS, Radolf JD, editors. Caister Academic; Norfolk, UK: 2010. pp. 7–442.
    1. Paster BJ, et al. Phylogenetic analysis of the spirochetes. J Bacteriol. 1991;173(19):6101–6109. - PMC - PubMed
    1. Vollmer W, Blanot D, de Pedro MA. Peptidoglycan structure and architecture. FEMS Microbiol Rev. 2008;32(2):149–167. - PubMed

Publication types

MeSH terms