. 2017 Feb;19(1):130-137.
doi: 10.1007/s11307-016-0994-1.

Quantitative [18F]FMISO PET Imaging Shows Reduction of Hypoxia Following Trastuzumab in a Murine Model of HER2+ Breast Cancer

Affiliations

Quantitative [18F]FMISO PET Imaging Shows Reduction of Hypoxia Following Trastuzumab in a Murine Model of HER2+ Breast Cancer

Anna G Sorace et al. Mol Imaging Biol. 2017 Feb.

Abstract

Purpose: Evaluation of [18F]fluoromisonidazole ([18F]FMISO)-positron emission tomography (PET) imaging as a metric for evaluating early response to trastuzumab therapy with histological validation in a murine model of HER2+ breast cancer.

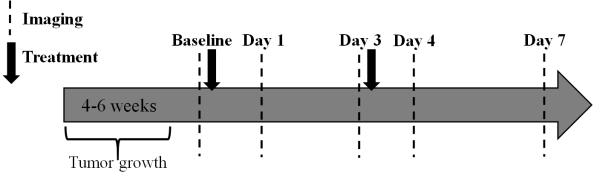
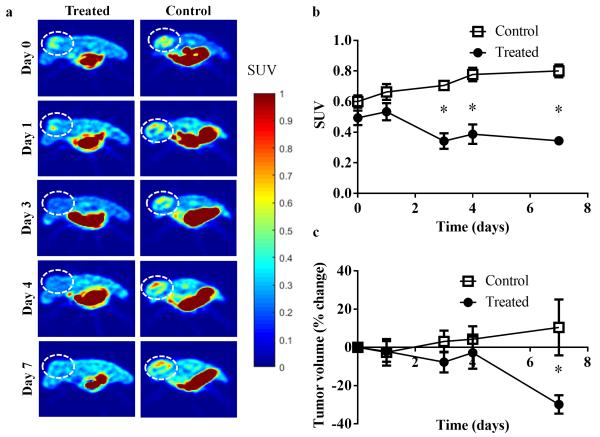
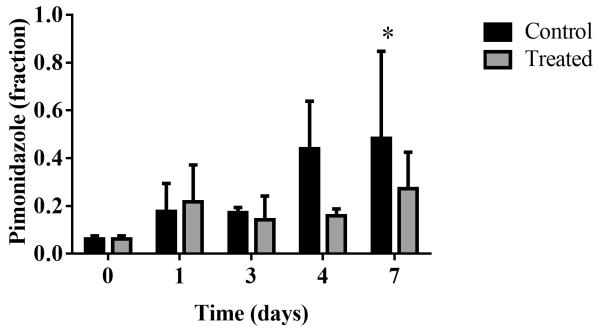
Procedures: Mice with BT474, HER2+ tumors, were imaged with [18F]FMISO-PET during trastuzumab therapy. Pimonidazole staining was used to confirm hypoxia from imaging.

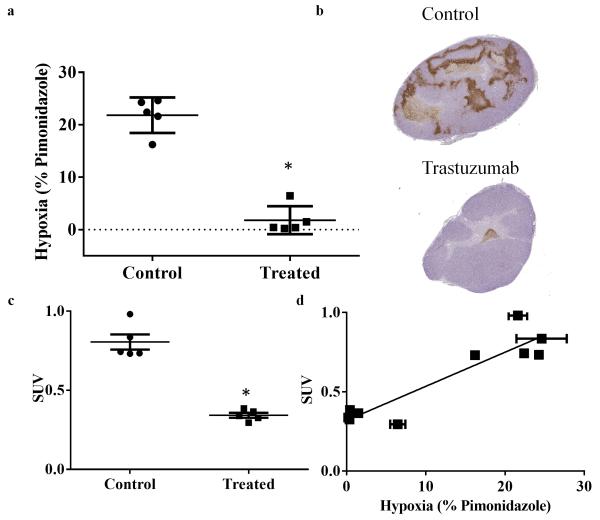
Results: [18F]FMISO-PET indicated significant decreases in hypoxia beginning on day 3 (P < 0.01) prior to changes in tumor size. These results were confirmed with pimonidazole staining on day 7 (P < 0.01); additionally, there was a significant positive linear correlation between histology and PET imaging (r 2 = 0.85).

Conclusions: [18F]FMISO-PET is a clinically relevant modality which provides the opportunity to (1) predict response to HER2+ therapy before changes in tumor size and (2) identify decreases in hypoxia which has the potential to guide subsequent therapy.

Keywords: BT474; FMISO; Herceptin; Misonidazole; Oxygenation; Pimonidazole; Vascular maturation.


Figures

Fig 1
Fig 1
Outline of tumor implantation, imaging and treatment schedule.
Fig 2
Fig 2
a Longitudinal [18F]-FMISO-PET central slice images of a representative control and treated animal (tumor denoted by dashed circle) over seven days. [18F]-FMISO retention increased longitudinally in the control mouse, in contrast to the observed decrease in the trastuzumab- treated mouse. b Graph revealing group mean of hotspot SUV in control versus treated tumors. [18F]-FMISO uptake in treated tumors is significantly lower than controls as early as day three (P = 0.008). c Graph of tumor volume changes in response to treatment over seven days. Day seven reveals a significant difference between the groups (P = 0.02).
Fig 3
Fig 3
Correlation of hypoxia imaging and histology is shown through central slice analysis of the treated and control tumors. a Graph revealing quantitative analysis of percent hypoxia staining from histology. Treated tumors reveal significantly decreased hypoxia compared to controls. b Representative histology central slices showing overall hypoxia (as stained with pimonidazole, brown) in the treated and control animals. c Day seven scatterplot of central slice SUV comparing treatment and controls. d Quantitative hypoxia imaging (SUV hotspot) and quantitative histology shows a positive linear correlation (r2 = 0.85, P < 0.001).
Fig 4
Fig 4
Quantitative analysis comparing treated and control tumors and representative histology sections are shown for H&E and CD31. CD31 microvessel density (MVD) is shown for a control and b treated tumors; c quantitative analysis reveals no significant changes between the groups on day seven (P = 0.22). H&E cellularity is shown for d control and e treated tumors; f quantitative analysis reveals no significant difference in cellularity in treated tumors compared to controls on day seven (P = 0.22). H&E percent necrosis is shown for g control and h treated tumors; i quantitative analysis reveals no significant changes in necrosis in treated tumors compared to controls on day seven (P = 0.53). Squares in g and h demonstrate the representative regions displayed in tiles a,c and b,d, respectively.
Fig 5
Fig 5
Longitudinal immunofluorescence analysis of pimonidazole in separate cohorts of mice over 7 days confirm trends of decreased hypoxia markers in trastuzumab-treated tumors.

References

    1. Hammond EM, Asselin MC, Forster D, O'Connor JP, Senra JM, Williams KJ. The meaning, measurement and modification of hypoxia in the laboratory and the clinic. Clin Oncol (R Coll Radiol) 2014;26:277–288. - PubMed
    1. Helmlinger G, Yuan F, Dellian M, Jain RK. Interstitial pH and pO2 gradients in solid tumors in vivo: high-resolution measurements reveal a lack of correlation. Nat Med. 1997;3:177–182. - PubMed
    1. Gruber G, Greiner RH, Hlushchuk R, et al. Hypoxia-inducible factor 1 alpha in high-risk breast cancer: an independent prognostic parameter? Breast Cancer Res. 2004;6:R191–198. - PMC - PubMed
    1. Goel S, Duda DG, Xu L, et al. Normalization of the vasculature for treatment of cancer and other diseases. Physiol Rev. 2011;91:1071–1121. - PMC - PubMed
    1. Mankoff DA, Dunnwald LK, Partridge SC, Specht JM. Blood flow-metabolism mismatch: good for the tumor, bad for the patient. Clin Cancer Res. 2009;15:5294–5296. - PMC - PubMed

Publication types

MeSH terms

LinkOut - more resources