. 2016 Aug 10:7:12331.
doi: 10.1038/ncomms12331.

Early programming of the oocyte epigenome temporally controls late prophase I transcription and chromatin remodelling

Affiliations

Early programming of the oocyte epigenome temporally controls late prophase I transcription and chromatin remodelling

Paulo Navarro-Costa et al. Nat Commun. .

Abstract

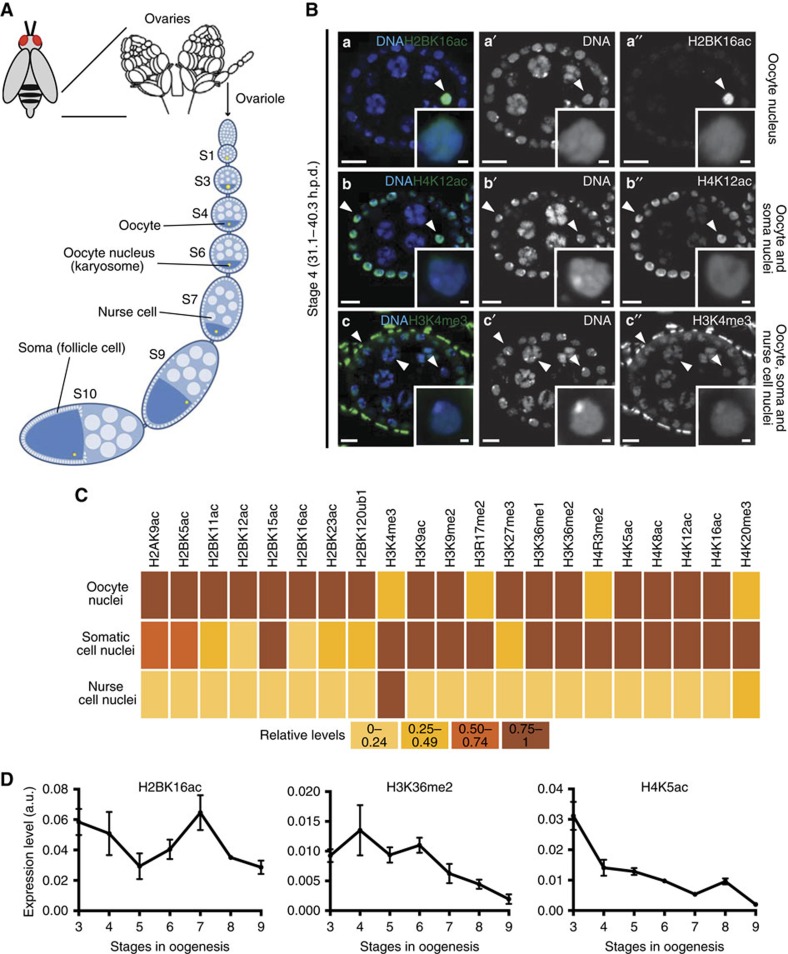
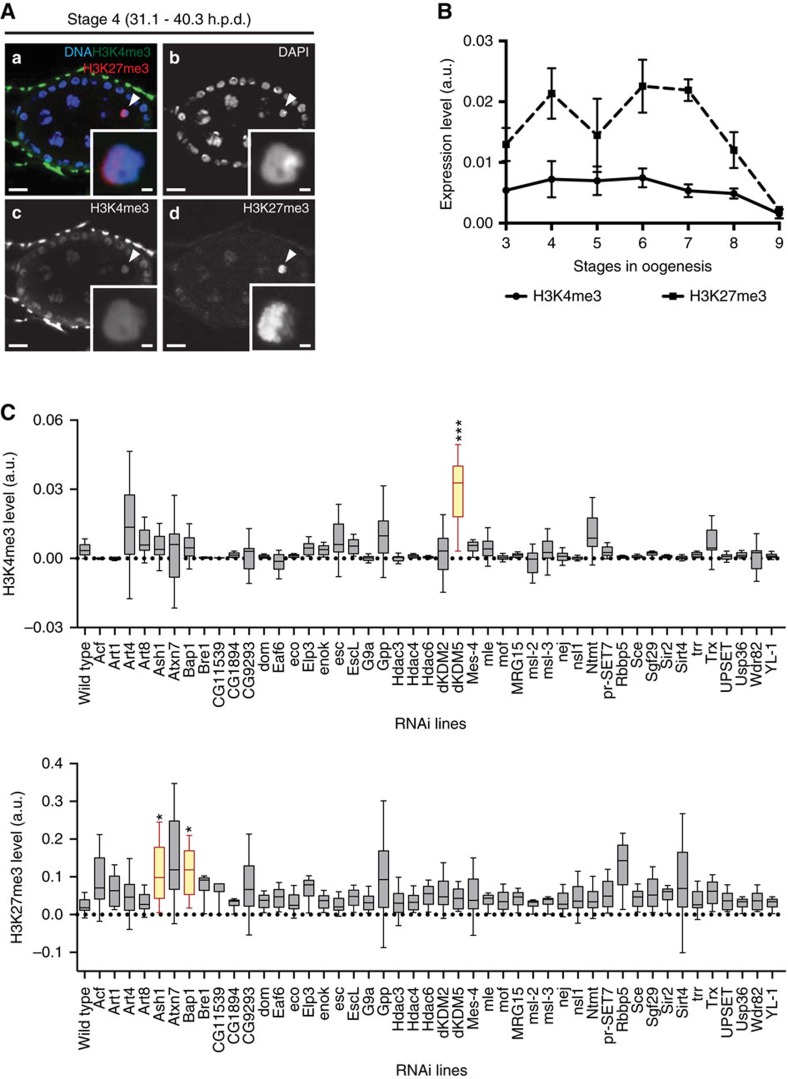
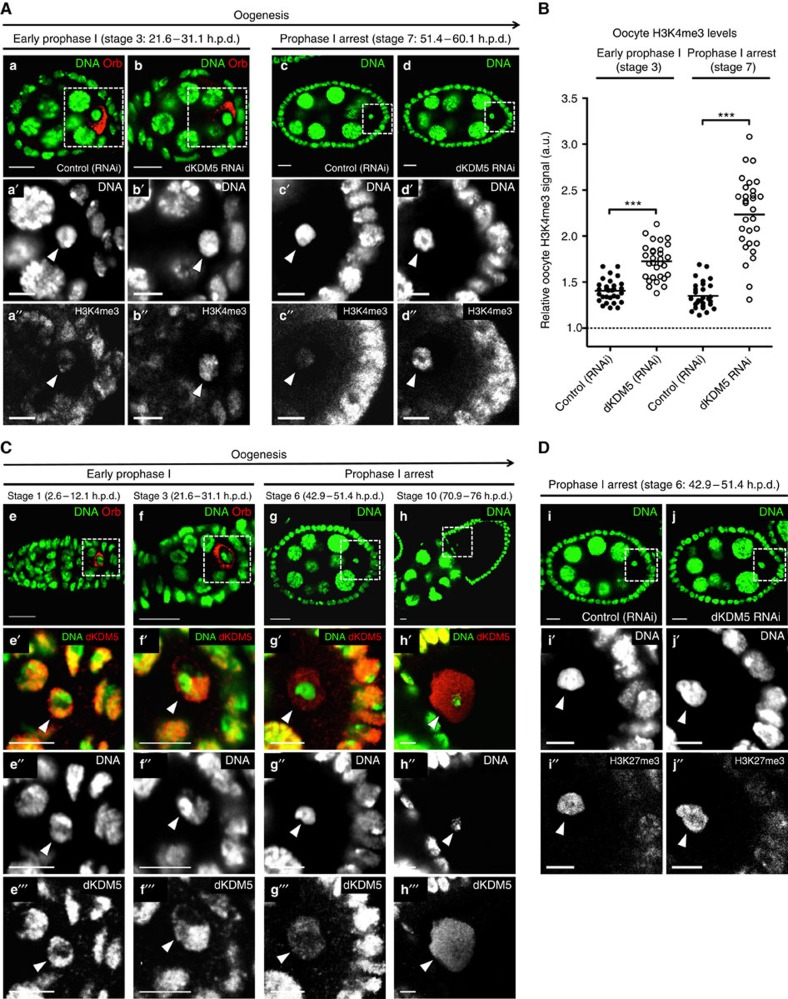
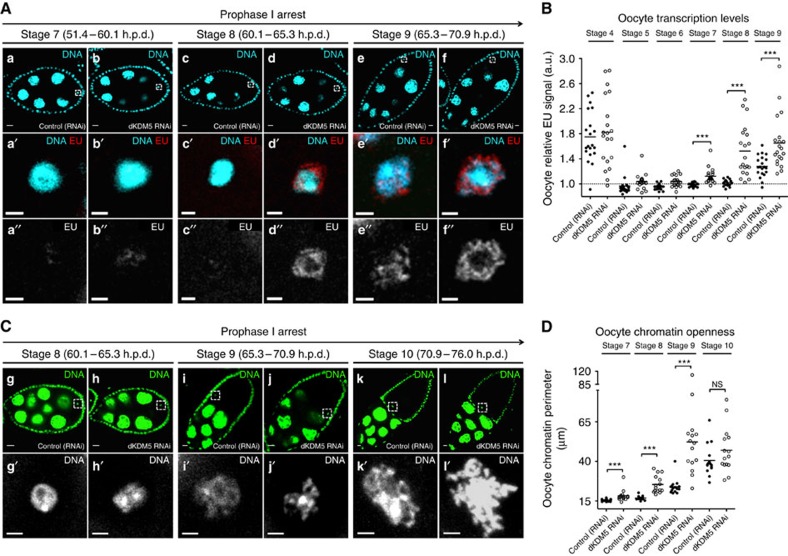
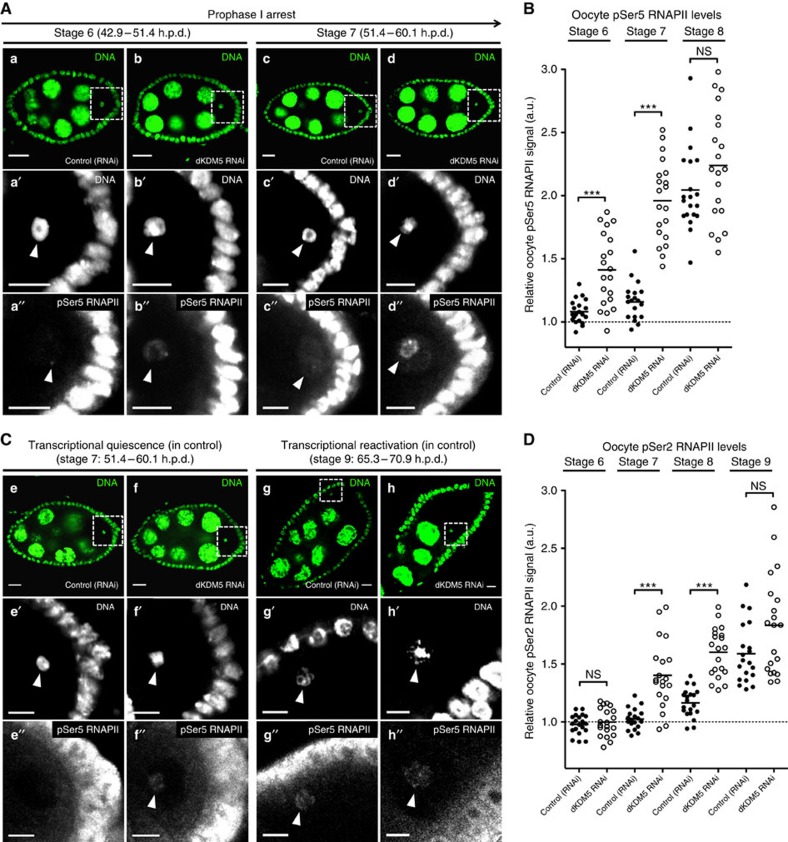
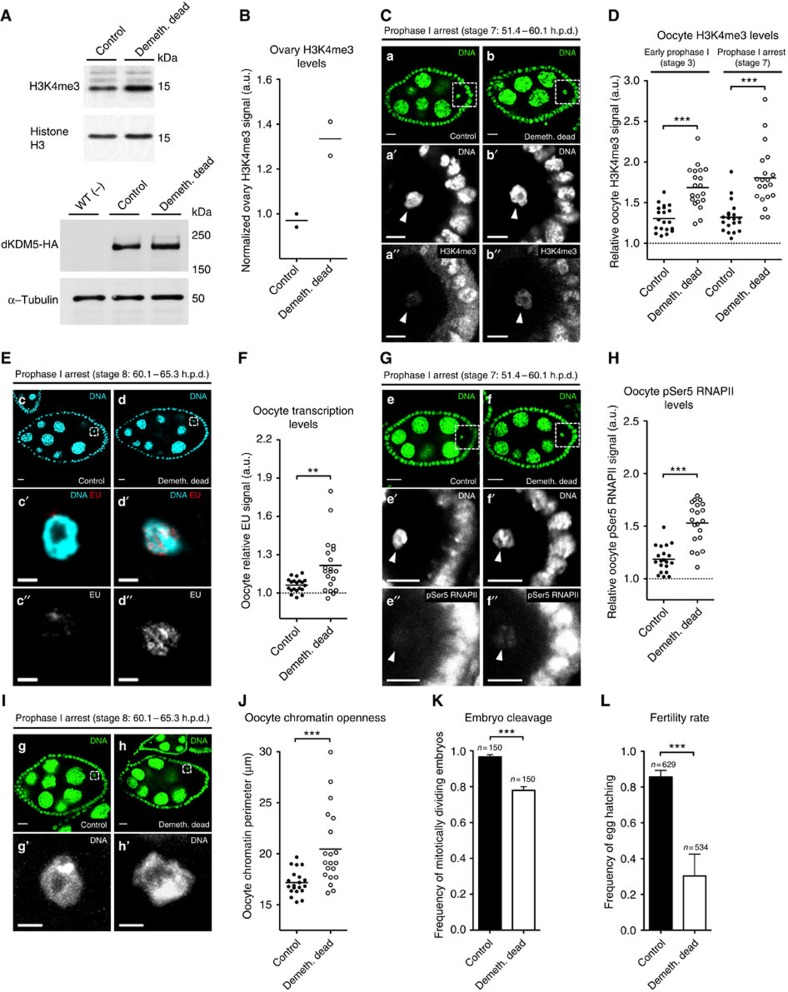
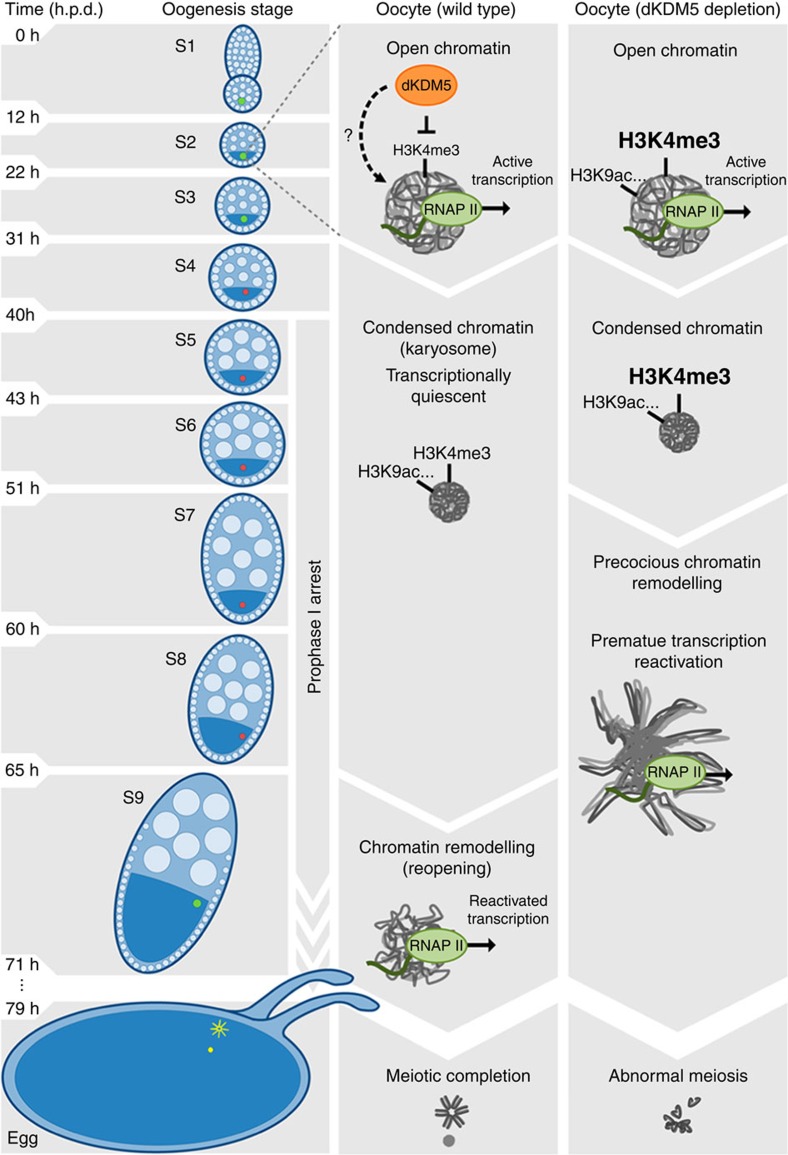
Oocytes are arrested for long periods of time in the prophase of the first meiotic division (prophase I). As chromosome condensation poses significant constraints to gene expression, the mechanisms regulating transcriptional activity in the prophase I-arrested oocyte are still not entirely understood. We hypothesized that gene expression during the prophase I arrest is primarily epigenetically regulated. Here we comprehensively define the Drosophila female germ line epigenome throughout oogenesis and show that the oocyte has a unique, dynamic and remarkably diversified epigenome characterized by the presence of both euchromatic and heterochromatic marks. We observed that the perturbation of the oocyte's epigenome in early oogenesis, through depletion of the dKDM5 histone demethylase, results in the temporal deregulation of meiotic transcription and affects female fertility. Taken together, our results indicate that the early programming of the oocyte epigenome primes meiotic chromatin for subsequent functions in late prophase I.


Figures

Figure 1
Figure 1. Drosophila oocytes have a unique, dynamic and diversified epigenome.
(A) Schematic of Drosophila oogenesis. The functional unit of the Drosophila ovary is the ovarian follicle or egg chamber, which consists of the cyst defined by the oocyte and its supporting nurse cells surrounded by a monolayer of somatic cells (follicle cells). The morphological features of the ovarian follicles define 14 distinct developmental stages (S). The oocyte progresses through the initial phases of prophase I until it arrests at diplotene at oogenesis stage 5. The onset of this arrest is preceded by the clustering of oocyte chromosomes into a highly compact and transcriptionally quiescent structure—the karyosome. As oogenesis progresses the oocyte grows in size mainly through cytoplasmic transfer from the nurse cells. At stage 9 the oocyte reactivates transcription, which lasts until the start of stage 11. The prophase I arrest is lifted at stage 13 and results in the formation of a metaphase I-arrested gamete. (B) Distinct patterns of histone post-translation modifications (PTMs) in the Drosophila ovarian follicle. Three main patterns were identified: (i) oocyte-specific expression (histone H2B lysine 16 acetylation—H2BK16ac; aa′′), (ii) oocyte+somatic (follicle) cell expression (histone H4 lysine 12 acetylation—H4K12ac; bb′′), and generalized distribution (oocyte (albeit sometimes at lower levels)+nurse cells+somatic cells; histone H3 lysine 4 trimethylation—H3K4me3; cc′′). Arrowheads point to the chromatin of different cell types, insets depict oocyte chromatin. Development time in relation to the start of oogenesis is expressed in hours post-germ line stem cell division (h.p.d.). Scale bars, 10 μm for ovarian follicles and 1 μm for oocyte insets. (C) Heatmap representing the expression of 21 different histone PTMs across the three different cell types of the Drosophila ovarian follicle. (D). Temporal analysis of the highly dynamic levels of oocyte H2BK16ac, histone H3 lysine 36 dimethylation (H3K36me2) and histone H4 lysine 5 acetylation (H4K5ac) throughout oogenesis. Relative levels are expressed in fluorescence arbitrary units (a.u.). Error bars represent s.d. See Supplementary Fig. 2 for illustrative micrographs and complete temporal analysis of the tested PTMs.
Figure 2
Figure 2. A germ line-specific in vivo RNAi screen identified three major regulators of the oocyte epigenome.
(A) The Drosophila oocyte has both activating (histone H3 lysine 4 trimethylation—H3K4me3) and repressive (histone H3 lysine 27 trimethylation—H3K27me3) marks (ad). Development time in relation to the start of oogenesis is expressed in hours post-germ line stem cell division (h.p.d.). Arrowheads and insets indicate oocyte chromatin. Scale bars, 10 μm for ovarian follicles and 1 μm for oocyte insets. (B) Temporal analysis of oocyte H3K27me3 and H3K4me3 levels throughout oogenesis. The high levels of H3K27me3 during the prophase I arrest are marked by a reduction prior to the onset of oocyte transcriptional reactivation (stage 9). H3K4me3 levels are kept at a low level throughout prophase I. Histone post-translation modifications (PTMs) relative levels are expressed in fluorescence arbitrary units (a.u.). Error bars represent the s.e.m. A total of six replicates were analysed for each data point. (C) Effects of the RNAi-mediated knockdown of different chromatin remodellers on oocyte H3K4me3 (top) and H3K27me3 (bottom) levels. A total of 46 different chromatin remodellers were compatible with the development to mid-oogenesis when depleted specifically in the germ line. Of these, three (dKDM5, Ash1 and Bap1) introduced significant disturbances to the oocyte epigenome. Relative histone PTM signals are expressed in fluorescence arbitrary units (a.u.), horizontal lines specify median values, error bars represent s.d. and asterisks indicate significant difference (paired t-test; P<0.04).
Figure 3
Figure 3. Oocyte H3K4me3 levels are specified in early oogenesis by the histone demethylase dKDM5.
(A,B) Germ line-specific knockdown of the histone demethylase dKDM5 significantly increases histone H3 lysine 4 trimethylation (H3K4me3) levels in prophase I oocytes (ad′′). Oocyte H3K4me3 levels were compared at stages 3 and 7 of oogenesis (before and after the establishment of the prophase I arrest, respectively). Signal quantification (B) is represented per oocyte and is expressed in fluorescence arbitrary units (a.u.). Horizontal lines specify mean values and asterisks indicate significant difference (Mann–Whitney U-test; P<0.0001). Similar results were obtained with a dkdm5−/− mutant (Supplementary Fig. 4A,B). (C) dKDM5 is evicted from oocyte chromatin during early oogenesis, prior to the establishment of the prophase I arrest (eh′′′) At the very start of prophase I (oogenesis stage 1), dKDM5 co-localizes with oocyte chromatin (ee′′′) As the oocyte's chromosomes begin to cluster together to form the karyosome (oogenesis stage 3), dKDM5 is partially evicted from chromatin (ff′′′) During the prophase I arrest (oogenesis stage 6 as representative example) dKDM5 does not co-localize with oocyte chromatin, being restricted to the nucleoplasm (gg′′′) dKDM5 remains evicted during the transcriptional reactivation of the oocyte in late prophase I (oogenesis stage 10; h–h′′′). See Supplementary Fig. 9 for quantification. The dKDM5 signal corresponds to a genomic dkdm5 transgene containing a C-terminal human influenza hemagglutinin (HA) tag crossed into the dkdm5−/− mutant background (antibody: anti-HA). (D) Oocyte heterochromatin is not globally affected by the germ line-specific knockdown of dKDM5. Heterochromatin of both the facultative (histone H3 lysine 27 trimethylation—H3K27me3) and constitutive (histone H3 lysine 9 dimethylation—H3K9me2) type remained unchanged after dKDM5 knockdown (ij′′ and Supplementary Fig. 6). Quantifications of oocyte H3K27me3 and H3K9me2 levels are shown in Supplementary Fig. 6. (AD) Development time in relation to the start of oogenesis is expressed in hours post-germ line stem cell division (h.p.d.). Rectangles delimit the area of the oocyte insets and arrowheads point to the oocyte chromatin/nucleus. To distinguish early prophase I oocytes from other germ line cells, an oocyte cytoplasm-specific staining was performed (Orb). Scale bars, 10 μm for ovarian follicles and 5 μm for oocyte insets.
Figure 4
Figure 4. dKDM5 temporally regulates the reactivation of transcription and chromatin remodelling during the prophase I arrest.
(A,B) The germ line-specific knockdown of the histone demethylase dKDM5 results in the premature transcriptional reactivation of prophase I-arrested oocytes (af′′) Oocyte transcription was robustly detected approximately 14 h earlier in dKDM5-depleted conditions when compared with controls: oogenesis stage 7 versus stage 9, respectively. Oocyte transcription was measured by incorporation of the modified nucleotide ethynyl uridine (EU). The specificity of this assay for nascent RNA was confirmed by treatment with the transcription inhibitor Actinomycin D (Supplementary Fig. 13). Signal quantification (B) is represented per oocyte and is expressed in fluorescence arbitrary units (a.u.). Horizontal lines specify mean values and asterisks indicate significant difference (Mann–Whitney U-test; P≤0.0005). Similar results were obtained with a dkdm5−/− mutant (Supplementary Fig. 4C,D). (C,D) Meiotic chromosome compaction is remodelled during transcriptional reactivation (gl′). Under control conditions, the karyosome-compacted meiotic chromosomes resolve into chromatin protrusions for a period of ∼11 h in late prophase I (from oogenesis stages 9 to 11). dKDM5 knockdown doubled this period to ∼20 h by inducing karyosome opening starting from stage 7 and introduced significant morphological abnormalities to the chromatin (j′,l′). The perimeter of oocyte chromatin (in μm) was measured for phenotypic quantification of chromatin openness (see D). Horizontal lines specify mean values, asterisks indicate significant difference and ‘NS' no significant difference (Mann–Whitney U-test; P≤0.0002). Similar results were obtained with a dkdm5−/− mutant (Supplementary Fig. 4I,J). (AD) Development time in relation to the start of oogenesis is expressed in hours post-germ line stem cell division (h.p.d.). Rectangles delimit the area of the oocyte insets. Scale bars, 10 μm for ovarian follicles and 2 μm for oocyte insets.
Figure 5
Figure 5. dKDM5 determines the levels of RNA polymerase II in prophase I-arrested chromatin.
(A,B) The germ line-specific knockdown of the histone demethylase dKDM5 significantly increases the levels of RNA polymerase II phosphorylated at position serine 5 of the C-terminal repeat domain (pSer5 RNAPII) in the chromatin of prophase I-arrested oocytes (ad′′). (C,D) Significantly higher levels of transcription elongation (active RNAPII) are observed during the precocious transcriptional reactivation of dKDM5-depleted oocytes (oogenesis stages 7 and 8: ef′′; compare with transcriptionally reactivated oocytes in gh′′). Active polymerase corresponds to RNAPII phosphorylated at position serine 2 of the C-terminal repeat domain: pSer2 RNAPII. Signal quantification (B,D) is represented per oocyte and is expressed in fluorescence arbitrary units (a.u.). Horizontal lines indicate mean values, asterisks indicate significant difference and ‘NS' no significant difference (Mann–Whitney U-test; P<0.0001). Similar results were obtained with a dkdm5−/− mutant (Supplementary Fig. 4E–H). (AD) Development time in relation to the start of oogenesis is expressed in hours post-germ line stem cell division (h.p.d.). Rectangles delimit the area of the oocyte insets, arrowheads point to the oocyte's chromatin. Scale bars, 10 μm for ovarian follicles and 5 μm for oocyte insets.
Figure 6
Figure 6. dKDM5 is required for meiotic completion and female fertility.
(A) dKDM5 is required for correct meiosis. Polar body morphology was used as read-out for successful meiotic completion. Under normal conditions, polar body chromosomes are arranged in a characteristic rosette conformation (a). dKDM5 knockdown resulted in significant deviations to this conformation, with scattered chromatin (arrowhead) and defects in chromosome condensation (b,c). The perimeter of polar body chromatin (in μm) was measured for phenotypic quantification. Horizontal lines specify mean values and asterisks indicate significant difference (Mann–Whitney U-test; P=0.0031). (B) dKDM5-depleted eggs largely fail to initiate mitotic divisions after fertilization (de′). The chromatin of such embryos was scattered (arrowhead in chromatin inset e′) and disorganized despite normal gamete size and dorsal–ventral patterning (Supplementary Fig. 11). Error bars represent s.d. and asterisks indicate significant difference (Student's t-test; P<0.0001). (C) Germ line-specific depletion of dKDM5 significantly impairs Drosophila fertility. Fertility rate is defined by the frequency of egg hatching 48 h post oviposition. Error bars represent s.d. and asterisks indicate significant difference (Student's t-test; P<0.0001). (AC) Scale bars in ac, 2 μm; in d and e, 30 μm and in e′, 10 μm.
Figure 7
Figure 7. The demethylase activity of dKDM5 is required for oocyte transcriptional regulation and female fertility.
(A,B) Loss of dKDM5 demethylase activity (demethylase-dead genomic dKDM5 transgene; Demeth. dead) significantly increases histone H3 lysine 4 trimethylation (H3K4me3) levels in the ovary. The normalized ratio between the H3K4me3 and histone H3 signals is expressed in arbitrary units (a.u.; see B). Protein immunoblots for dKDM5-HA (bottom panels) confirm that the demethylase-dead allele does not impair dKDM5 protein stability (quantification in Supplementary Fig. 12). WT (−) corresponds to flies without the HA-tagged transgenes. (C,D) Loss of dKDM5 demethylase activity significantly increases oocyte H3K4me3 (ab′′). Oocyte H3K4me3 levels were compared before (oogenesis stage 3) and after (stage 7) the establishment of the prophase I arrest (Mann–Whitney U-test; P<0.0001). (E,F) Loss of dKDM5 demethylase activity induces premature oocyte transcription reactivation during the prophase I arrest (cd′′) Oocyte transcription was measured by incorporation of the ethynyl uridine (EU) nucleotide (Mann–Whitney U-test; P=0.0084). (G,H) Loss of dKDM5 demethylase activity increases the levels of Ser5-phosphorylated RNA polymerase II in oocyte chromatin (pSer5 RNAPII; ef′′; Mann–Whitney U-test; P<0.0001). (I,J) Precocious prophase I oocyte chromatin remodeling after loss of dKDM5 demethylase activity (gh′). Oocyte chromatin openness was measured by calculating the perimeter of total chromatin volume (see J; Mann–Whitney U-test; P=0.0004). (K) Loss of dKDM5 demethylase activity impairs the initiation of embryonic mitotic divisions after fertilization. Error bars represent standard deviation (Student's t-test; P=0.0002). (L) Loss of dKDM5 demethylase activity significantly reduces Drosophila female fertility. Error bars represent s.d. (Student's t-test; P=0.0001). (BL) Development time in relation to the start of oogenesis is expressed in hours post-germ line stem cell division (h.p.d.). Rectangles delimit the area of the depicted oocyte insets and arrowheads point to the oocyte's chromatin. Scale bars, 10 μm for ovarian follicles, 5 μm (a′b′′ and e′f′′) and 2 μm (c′d′′ and g′h′) for oocyte insets. Results of each independent experiment are plotted, horizontal lines specify mean values and asterisks indicate significant difference. Please see Supplementary Fig. 4 to compare phenotypical penetrance against a transheterozygous dkdm5−/− mutant.
Figure 8
Figure 8. Proposed model for the epigenetic regulation of prophase I chromosome activity.
The histone demethylase dKDM5 programs the oocyte chromatin state during early oogenesis, through its actions on H3K4me3 and other epigenetic modifications such as H3K9ac. Once programmed, the dKDM5-dependent oocyte epigenome temporally controls, several hours afterwards in late prophase I, the onset of transcription and meiotic chromosome remodeling. Ultimately, the germ line-specific activity of dKDM5 is required for successful completion of meiosis and female fertility. Development time in relation to the start of oogenesis is expressed in hours post-germ line stem cell division (h.p.d.).

References

    1. Von Stetina J. R. & Orr-Weaver T. L. Developmental control of oocyte maturation and egg activation in metazoan models. Cold Spring Harb. Perspect. Biol. 3, a005553 (2011). - PMC - PubMed
    1. Gerton J. L. & Hawley R. S. Homologous chromosome interactions in meiosis: diversity amidst conservation. Nat. Rev. Genet. 6, 477–487 (2005). - PubMed
    1. Martinez-Balbas M. A., Dey A., Rabindran S. K., Ozato K. & Wu C. Displacement of sequence-specific transcription factors from mitotic chromatin. Cell 83, 29–38 (1995). - PubMed
    1. Gottesfeld J. M. & Forbes D. J. Mitotic repression of the transcriptional machinery. Trends Biochem. Sci. 22, 197–202 (1997). - PubMed
    1. Davidson E. H. in Gene Activity in Early Development 307–408Academic Press (1986).

Publication types

LinkOut - more resources