

Progress to extinction: increased specialisation causes the demise of animal clades
- PMID: 27507121
- PMCID: PMC4978992
- DOI: 10.1038/srep30965
Progress to extinction: increased specialisation causes the demise of animal clades
Abstract
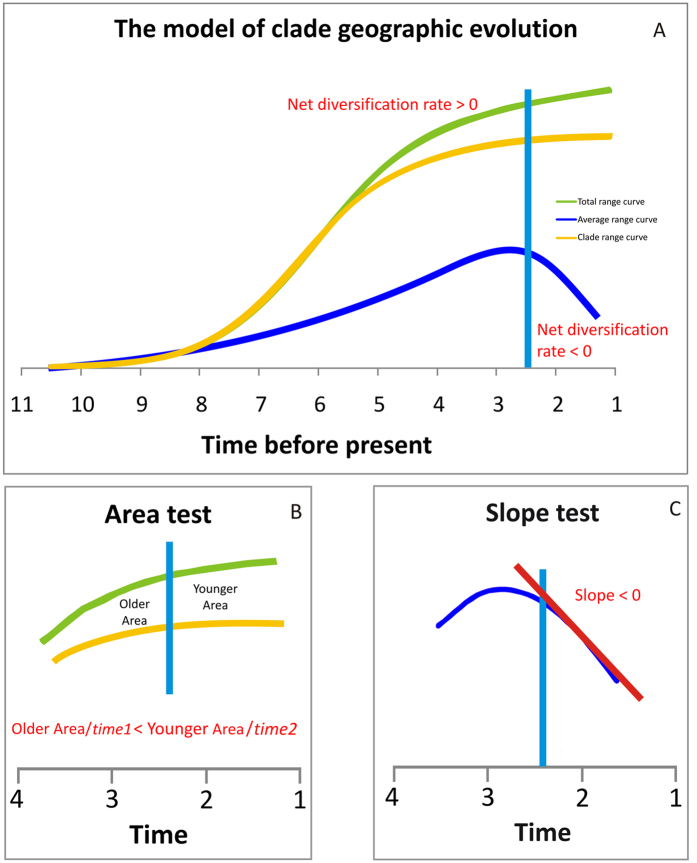
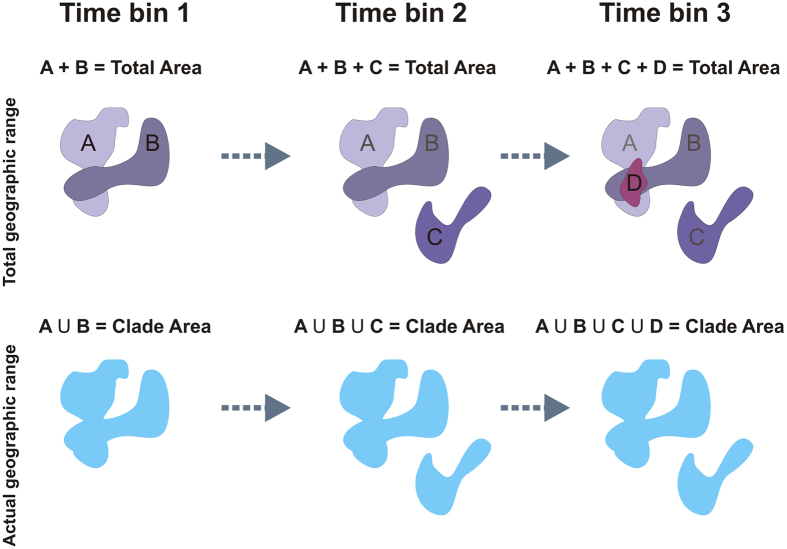
Animal clades tend to follow a predictable path of waxing and waning during their existence, regardless of their total species richness or geographic coverage. Clades begin small and undifferentiated, then expand to a peak in diversity and range, only to shift into a rarely broken decline towards extinction. While this trajectory is now well documented and broadly recognised, the reasons underlying it remain obscure. In particular, it is unknown why clade extinction is universal and occurs with such surprising regularity. Current explanations for paleontological extinctions call on the growing costs of biological interactions, geological accidents, evolutionary traps, and mass extinctions. While these are effective causes of extinction, they mainly apply to species, not clades. Although mass extinctions is the undeniable cause for the demise of a sizeable number of major taxa, we show here that clades escaping them go extinct because of the widespread tendency of evolution to produce increasingly specialised, sympatric, and geographically restricted species over time.
Figures
References
-
- Foote M., Crampton J. S., Beu A. G. & Cooper R. A. On the bidirectional relationship between geographic range and taxonomic duration. Paleobiology 34, 421–433 (2008).
-
- Foote M. et al.. Rise and fall of species occupancy in Cenozoic fossil mollusks. Science 318, 1131–1134 (2007). - PubMed
-
- Quental T. B. & Marshall C. R. How the Red Queen drives terrestrial mammals to extinction. Science 341, 290–292 (2013). - PubMed
-
- Carotenuto F., Barbera C. & Raia P. Occupancy, range size, and phylogeny in Eurasian Pliocene to Recent large mammals. Paleobiology 36, 399–414 (2010).
Publication types
MeSH terms
LinkOut - more resources
Full Text Sources
Other Literature Sources
Miscellaneous
