

Calibration of medical diagnostic classifier scores to the probability of disease
- PMID: 27507287
- PMCID: PMC5548655
- DOI: 10.1177/0962280216661371
Calibration of medical diagnostic classifier scores to the probability of disease
Abstract
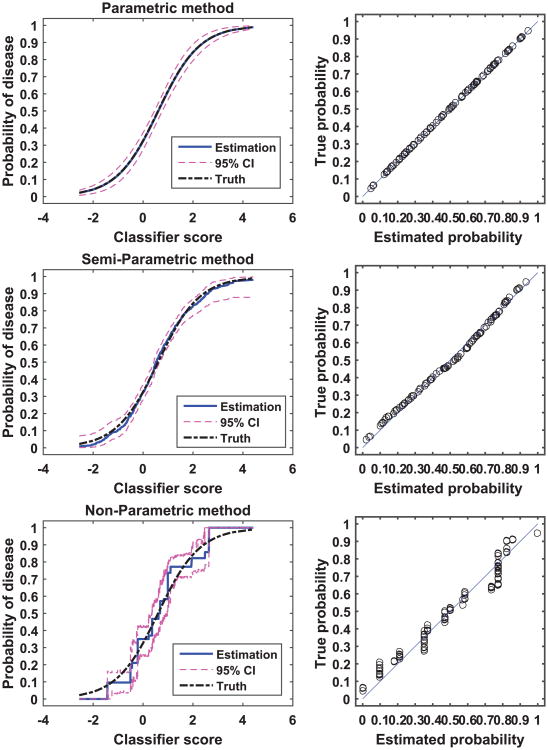
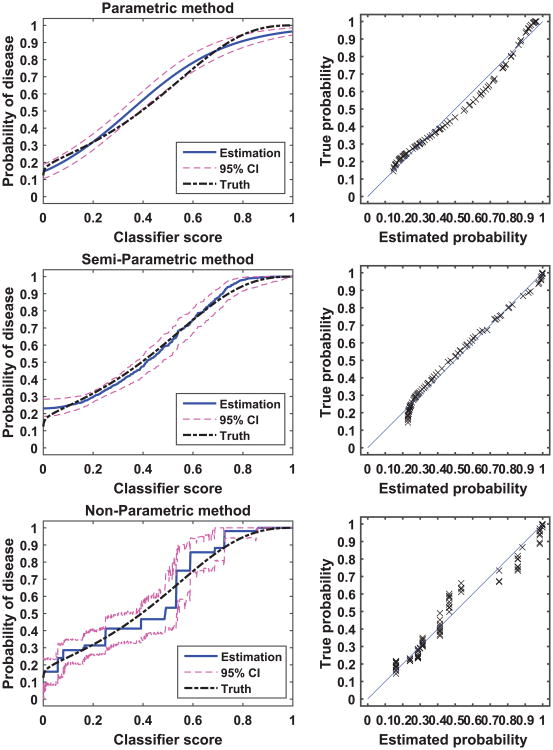
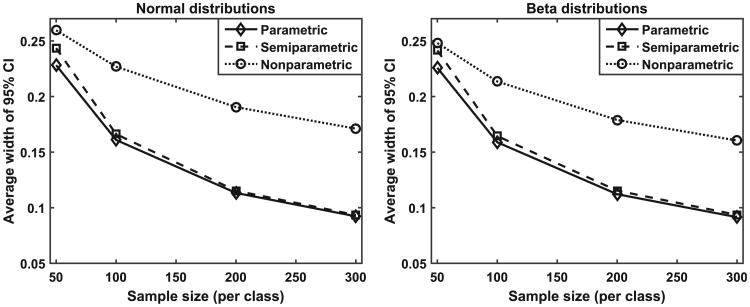
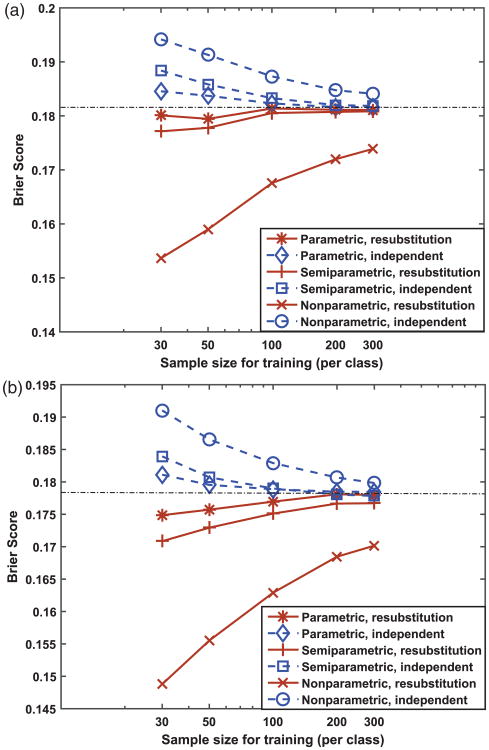
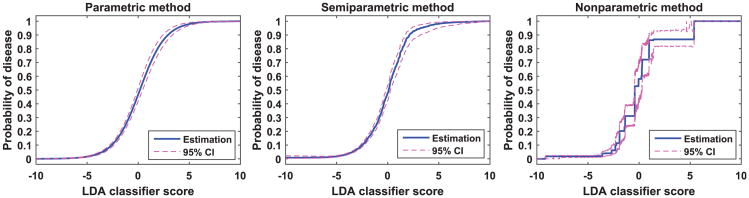
Scores produced by statistical classifiers in many clinical decision support systems and other medical diagnostic devices are generally on an arbitrary scale, so the clinical meaning of these scores is unclear. Calibration of classifier scores to a meaningful scale such as the probability of disease is potentially useful when such scores are used by a physician. In this work, we investigated three methods (parametric, semi-parametric, and non-parametric) for calibrating classifier scores to the probability of disease scale and developed uncertainty estimation techniques for these methods. We showed that classifier scores on arbitrary scales can be calibrated to the probability of disease scale without affecting their discrimination performance. With a finite dataset to train the calibration function, it is important to accompany the probability estimate with its confidence interval. Our simulations indicate that, when a dataset used for finding the transformation for calibration is also used for estimating the performance of calibration, the resubstitution bias exists for a performance metric involving the truth states in evaluating the calibration performance. However, the bias is small for the parametric and semi-parametric methods when the sample size is moderate to large (>100 per class).
Keywords: Calibration; classifier; probability of disease; rationality.
Conflict of interest statement
Figures


References
-
- Gail MH, Brinton LA, Byar DP, et al. Projecting individualized probabilities of developing breast cancer for white females who are being examined annually. J Natl Canc Inst. 1989;81:1879–1886. - PubMed
-
- Jain A, Nandakumar K, Ross A. Score normalization in multimodal biometric systems. Pattern Recogn. 2005;38:2270–2285.
-
- Platt JC. Probabilistic outputs for support vector machines and comparisons to regularized likelihood methods. In: Smola AJ, Bartlett PJ, Schölkopf B, et al., editors. Advances in large margin classifiers. Cambridge, MA: MIT Press; 2000. pp. 61–74.
MeSH terms
Grants and funding
LinkOut - more resources
Full Text Sources
Other Literature Sources
Medical
