. 2016 Dec;34(12):2930-2942.
doi: 10.1002/stem.2474. Epub 2016 Aug 29.

Quiescent Bone Lining Cells Are a Major Source of Osteoblasts During Adulthood

Affiliations

Quiescent Bone Lining Cells Are a Major Source of Osteoblasts During Adulthood

Igor Matic et al. Stem Cells. 2016 Dec.

Abstract

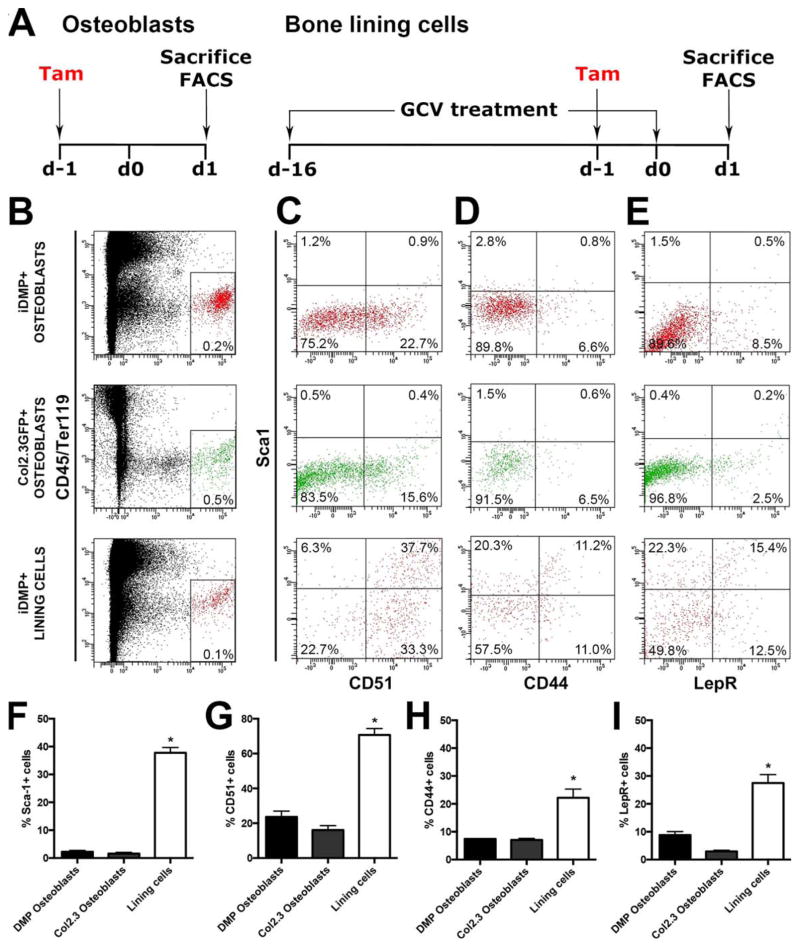
The in vivo origin of bone-producing osteoblasts is not fully defined. Skeletal stem cells, a population of mesenchymal stem cells resident in the bone marrow compartment, are thought to act as osteoprogenitors during growth and adulthood. Quiescent bone lining cells (BLCs) have been suggested as a population capable of activation into mature osteoblasts. These cells were defined by location and their morphology and studies addressing their significance have been hampered by their inaccessibility, and lack of markers that would allow for their identification and tracing. Using lineage tracing models, we have observed labeled osteoblasts at time points extending beyond the reported lifespan for this cell type, suggesting continuous reactivation of BLCs. BLCs also make a major contribution to bone formation after osteoblast ablation, which includes the ability to proliferate. In contrast, mesenchymal progenitors labeled by Gremlin1 or alpha smooth muscle actin do not contribute to bone formation in this setting. BLC activation is inhibited by glucocorticoids, which represent a well-established cause of osteoporosis. BLCs express cell surface markers characteristic of mesenchymal stem/progenitors that are largely absent in osteoblasts including Sca1 and Leptin Receptor. BLCs also show different gene expression profiles to osteoblasts, including elevated expression of Mmp13, and osteoclast regulators RANKL and macrophage colony stimulating factor, and retain osteogenic potential upon transplantation. Our findings provide evidence that bone lining cells represent a major source of osteoblasts during adulthood. Stem Cells 2016;34:2930-2942.

Keywords: Bone lining cell; Mesenchymal stem cell; Osteoblasts; Osteogenesis.


Conflict of interest statement

Disclosure of Potential Conflict of Interest

The authors indicate no potential conflicts of interest.

Figures

Figure 1
Figure 1
Bone lining cells are a continuous source of osteoblasts in mature bone. (A): For lineage tracing experiments, Dmp1CreERT2 mice were crossed with Ai9 reporter mice to generate iDMP. (B): Schematic of the experimental design. Cre activity was induced by 2 doses of tamoxifen (Tam), 24 hours apart (7.5 μg/g) in 2 month old mice and the animals were sacrificed as shown. Mineralizing surfaces were labeled with calcein a day before the mice were sacrificed for histological evaluation. (C–F): Representative femur sections from males are shown at the indicated time points. (G–L): Image analysis was used to evaluate changes in labeled surface (G, J), thickness of labeled cells (H, K) and proportion of labeled osteocytes (I, L) in cortical and trabecular bone regions (n = 3–4/group). Data are presented as mean ± SEM. *, p <.05 compared to day 1 using ANOVA with Dunnett’s post-test. Scale bars indicate 500 μm (C–F scans) or 50 μm (enlarged areas). Abbreviations: DMP1, dentin matrix protein 1.
Figure 2
Figure 2
iDMP+ cells within bone marrow do not expand. (A): iDMP mice were treated as indicated before BMSC cultures were established. (B): iDMP+ cells in the bone marrow show a dendritic morphology (x200 magnification). (C): iDMP+ cells in BMSC culture at day 6 do not have a stromal morphology (x100 magnification). (D): FACS analysis of the whole bone marrow indicates that the majority of iDMP+ cells are CD45+. (E–F): FACS analysis of primary BMSC cultures at day 6 and day 8 indicated a small proportion of iDMP+ CD45 cells. (G): Quantification of CD45 iDMP+ cells indicated a decrease over time in culture. Data is from 5 cultures. *, p <.05 determined by Student’s t test. Abbreviations: BMSC, bone marrow stromal cell cultures; Tam, tamoxifen.
Figure 3
Figure 3
Osteoblast ablation provides a model to study bone lining cells. (A): Dmp1CreERT2 mice were crossed with Col2.3ΔTK mice. Double transgenic offspring were crossed with Ai9 reporter mice to produce iDMP/TK. (B): Following osteoblast ablation with GCV treatment for 16 days, iDMP was activated by Tam and histological analysis was performed at the time points indicated. Mineralizing surfaces were labeled using calcein. Animals were 6–7 weeks old at the start of GCV treatment. (C–E): Representative histological sections of female mice are shown at the indicated time points following osteoblast ablation. Boxed areas show selected cortical and trabecular regions at higher magnification. iDMP+ cells are red, calcein is green. (F–K): Image analysis was used to evaluate changes in labeled surface (F, I), thickness of labeled cells (G, J) and proportion of labeled osteocytes (H, K) in cortical and trabecular bone regions (n = 3–4/ group). Quantification from controls without osteoblast ablation (no GCV, equivalent to day 1 on Supporting Information Fig. S1), or osteoblast ablation without tamoxifen labeling (No Tam) are also shown. (L–N): EdU staining (green) was performed to identify cells that were undergoing cell division within the day before sacrifice. Arrowheads indicate iDMP+ EdU+ cells. *, p <.05 compared to day 1 using ANOVA with Dunnett’s post-test. Scale bars indicate 500 μm (C–E scans) or 50 μm (enlarged areas, L–N). Abbreviations: BM, bone marrow; CB, cortical bone; GCV, ganciclovir; Tam, tamoxifen.
Figure 4
Figure 4
αSMA and Gremlin1 osteoprogenitor cells make minimal contribution to recovery following osteoblast ablation. (A–B): iSMA/TK mice underwent ganciclovir (GCV) and tamoxifen treatment as indicated in Figure 3B. At day 1 of recovery (A), few cells were iSMA+. By day 21 (B) iSMA+ cells contributed to marrow fibrosis, and a small proportion of cells on the bone surface, but iSMA+ osteocytes were absent. (C–D): Image analysis (n = 3) indicated increased iSMA+ labeled surface after recovery (C), but no increase in cell thickness (D). (E): When tamoxifen was administered on day 0 and day 1 of recovery, more iSMA+ cells were evident on the bone surface, and some osteocytes were iSMA+ (arrowheads). (F–G): iGremlin/TK mice underwent tamoxifen treatment (3 daily doses of 75 μg/g starting at 6–7 weeks of age) followed by GCV. At day 1 of recovery (F) almost no iGremlin+ cells were evident within the bone marrow. By day 21 (G) very few iGremlin+ cells were present on bone surfaces. Green indicates actively mineralizing surfaces (calcein in A–B, alizarin complexone in F–G). *, p <.05 by student’s t test. Scale bars indicate 500 μm (A, B, E–G scans) or 50 μm (enlarged areas). Abbreviation: αSMA, α-smooth muscle actin
Figure 5
Figure 5
Bone lining cells express mesenchymal stem cell markers. (A): iDMP+ osteoblast enriched population was isolated from iDMP mice treated only with tamoxifen by endosteal digest; iDMP+ bone lining cells were isolated from iDMP/TK mice after osteoblast ablation. Analysis was also performed using Col2.3GFP+ osteoblasts. (B): Analysis of cell surface markers was performed in the indicated cell populations. The x-axis represents tdTomato or GFP expression. (C–E): Representative FACS plots indicating the presence of Sca1 and CD51 (C), CD44 (D), and LepR, (E) on the different cell populations. Percentages are averages from at least three replicates. (F–I): Percentages of cells in each population positive for (F) Sca1, n = 4–10; (G) CD51, n = 4–9; (H) CD44, n = 3–4; and (I) LepR, n = 4–9; are indicated. *, p <.05 compared to iDMP osteoblasts using ANOVA with Dunnett’s post-test. Abbreviations: GCV, ganciclovir; LepR, leptin receptor; Tam, tamoxifen.
Figure 6
Figure 6
BLC form colonies in vitro and bone in vivo. (A): Experimental design for culture and transplantation experiments. For transplantation, freshly sorted cells (2–5,000) isolated from iDMP/TK mice were combined with wild-type bone marrow stromal cells and transplanted into a critical sized calvarial defect. (B): iDMP+ BLCs in the unpurified endosteal fraction form colonies that expand in vitro over time (scans performed at x50 magnification). (C): Following osteoblast ablation (GCV-treated), osteogenic differentiation is dramatically impaired in BMSC cultures, indicated by alkaline phosphatase (pink) and von kossa (brown) staining at day 21. Differentiation is also impaired in the endosteal fraction, shown at day 15. (D): Effect of osteoblast ablation on in vitro differentiation of BMSC and endosteal cells indicated by expression of osteogenic markers bone sialoprotein and osteocalcin. Data representative of 3–4 cultures is shown. (E): Histology of a calvarial defect transplanted with sorted BLCs indicating cells engrafted in the defect and contributing to new bone formation indicated by iDMP+ surface cells associated with calcein label, and labeled osteocytes embedded in newly formed bone (arrows). A representative image of three independent transplant experiments is shown. Scale bars indicate 100 μm. Abbreviations: BLC, bone lining cells; BMSC, bone marrow stromal cell; GCV, ganciclovir; ND, not detectable; Tam, tamoxifen.
Figure 7
Figure 7
Prednisolone inhibits activation of bone lining cells. (A): iDMP/TK mice underwent osteoblast ablation, followed by administration of prednisolone (Pred.) or placebo pellets according to the indicated experimental design. n = 3–5/group at each timepoint. (B): MicroCT reconstructions of representative bones after 21 days recovery indicate smaller trabecular regions in the prednisolone treated animals. Quantification of microCT is shown for the trabecular region (C) and cortical bone (D). Histology at day 7 in in bones from placebo (E) or prednisolone (F) treated mice indicated reduced activation of bone formation and bone lining cell activation. Labeled cells are indicated in red, calcein in green, and DAPI in blue. Quantification of the proportion of bone surface covered in labeled cells in both trabecular (G) and cortical (H) bone is shown. *, p <.05 by student’s t test. Scale bars indicate 1 mm (B), 500 μm (E, F scans) or 50 μm (E, F, enlarged areas). Abbreviations: GCV, ganciclovir; Tam, tamoxifen.

References

    1. Maes C, Kobayashi T, Selig MK, et al. Osteoblast precursors, but not mature osteoblasts, move into developing and fractured bones along with invading blood vessels. Dev Cell. 2010;19:329–344. - PMC - PubMed
    1. Yang L, Tsang KY, Tang HC, et al. Hypertrophic chondrocytes can become osteoblasts and osteocytes in endochondral bone formation. Proc Natl Acad Sci U S A. 2014;111:12097–12102. - PMC - PubMed
    1. Zhou X, von der Mark K, Henry S, et al. Chondrocytes transdifferentiate into osteoblasts in endochondral bone during development, postnatal growth and fracture healing in mice. PloS Genet. 2014;10:e1004820. - PMC - PubMed
    1. Colnot C. Skeletal cell fate decisions within periosteum and bone marrow during bone regeneration. J Bone Miner Res. 2009;24:274–282. - PMC - PubMed
    1. Grcevic D, Pejda S, Matthews BG, et al. In vivo fate mapping identifies mesenchymal progenitor cells. Stem Cells. 2012;30:187–196. - PMC - PubMed

MeSH terms