. 2016 Jul 26:7:1113.
doi: 10.3389/fmicb.2016.01113. eCollection 2016.

Comparison of Fusarium graminearum Transcriptomes on Living or Dead Wheat Differentiates Substrate-Responsive and Defense-Responsive Genes

Affiliations

Comparison of Fusarium graminearum Transcriptomes on Living or Dead Wheat Differentiates Substrate-Responsive and Defense-Responsive Genes

Stefan Boedi et al. Front Microbiol. .

Abstract

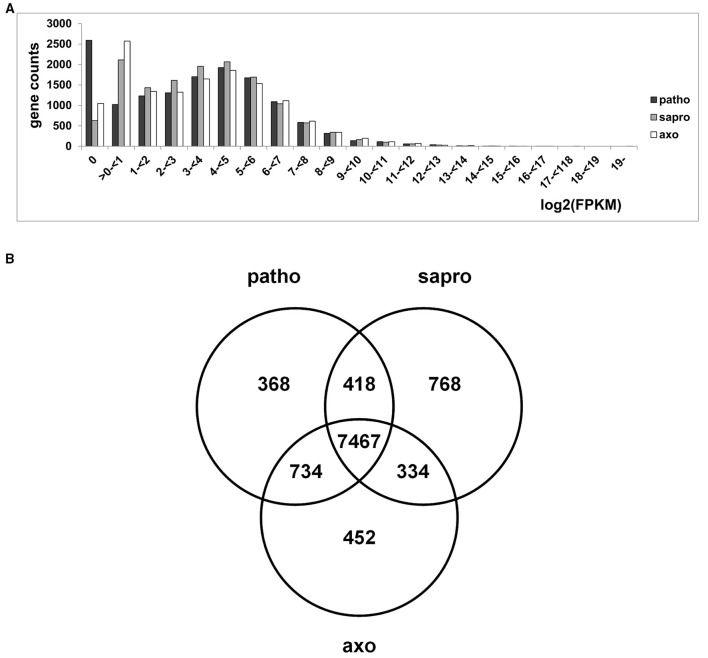
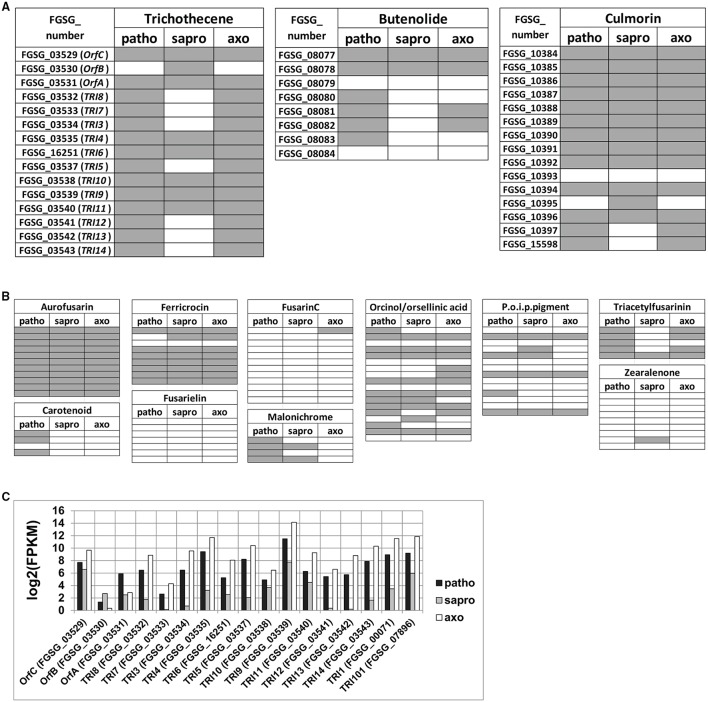
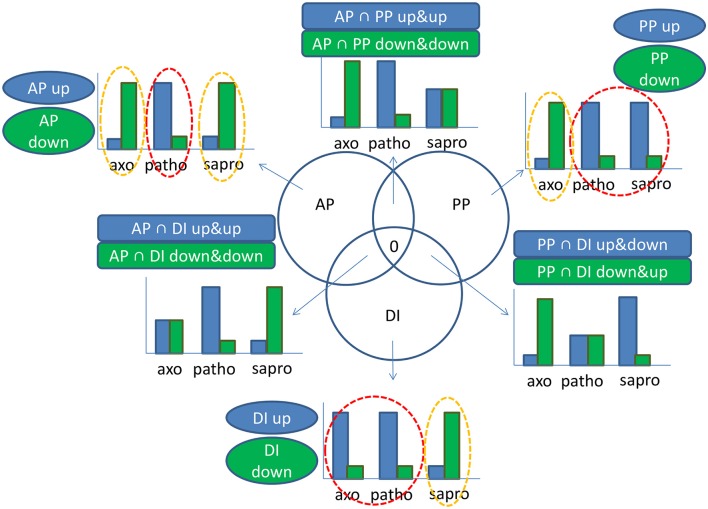
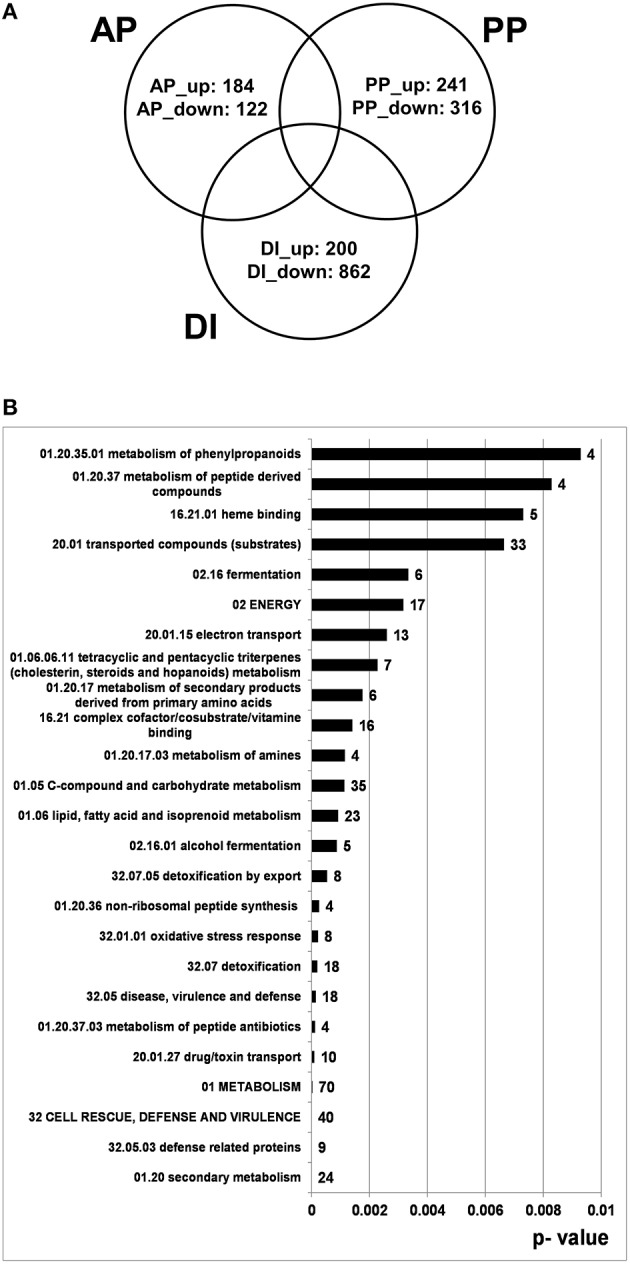
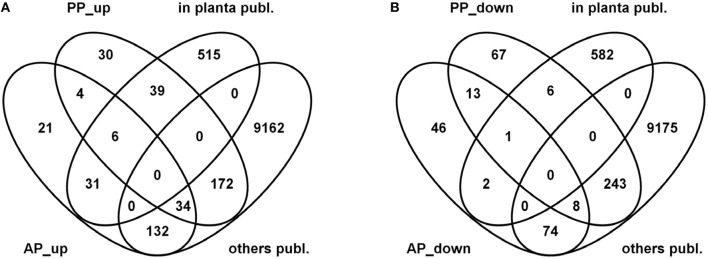
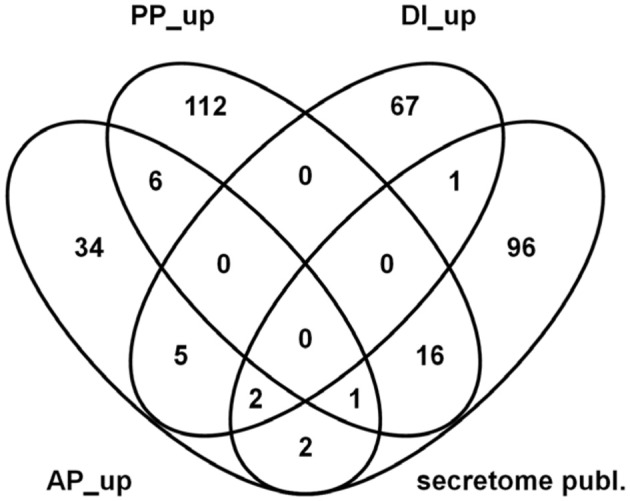
Fusarium graminearum is an opportunistic pathogen of cereals where it causes severe yield losses and concomitant mycotoxin contamination of the grains. The pathogen has mixed biotrophic and necrotrophic (saprophytic) growth phases during infection and the regulatory networks associated with these phases have so far always been analyzed together. In this study we compared the transcriptomes of fungal cells infecting a living, actively defending plant representing the mixed live style (pathogenic growth on living flowering wheat heads) to the response of the fungus infecting identical, but dead plant tissues (cold-killed flowering wheat heads) representing strictly saprophytic conditions. We found that the living plant actively suppressed fungal growth and promoted much higher toxin production in comparison to the identical plant tissue without metabolism suggesting that molecules signaling secondary metabolite induction are not pre-existing or not stable in the plant in sufficient amounts before infection. Differential gene expression analysis was used to define gene sets responding to the active or the passive plant as main impact factor and driver for gene expression. We correlated our results to the published F. graminearum transcriptomes, proteomes, and secretomes and found that only a limited number of in planta- expressed genes require the living plant for induction but the majority uses simply the plant tissue as signal. Many secondary metabolite (SM) gene clusters show a heterogeneous expression pattern within the cluster indicating that different genetic or epigenetic signals govern the expression of individual genes within a physically linked cluster. Our bioinformatic approach also identified fungal genes which were actively repressed by signals derived from the active plant and may thus represent direct targets of the plant defense against the invading pathogen.

Keywords: Fusarium; active plant; defense genes; passive plant; pathogenicity factors; secondary metabolism.


Figures

Figure 1
Figure 1
Workflow of the experimental set up. Three independent ears were inoculated on living plants representing pathogenic growth of the fungus. Another set of three ears, which were cut off the plant and shock-frozen in liquid nitrogen prior to spore application, was inoculated as “non- response” sample representing saprophytic growth of the fungus on the same plant material. Three and five days after inoculation (dai) samples were harvested. The infection rates were determined based on qPCR quantification of the proportion of fungal chromosomal DNA (chrDNA) within the fungus/wheat mixture (Brunner et al., 2009). Additionally to the plant experiment axenic media cultivation in presence of the DON inducing nitrogen source L-ornithine (Gardiner et al., 2009b) was carried out. All samples were subjected to chemical and molecular biological analysis. Quantitative secondary metabolite analysis was performed by LC/ESI-MS/MS against a set of analytical mycotoxin standards (Sulyok et al., ; Vishwanath et al., 2009). Sample processing was performed as detailed described in the text.
Figure 2
Figure 2
Photographs of pathogenic (A) and saprophytic (B) F. graminearum growth on Remus wheat heads 3 days after inoculation (dai). Black arrows in (A) point toward brownish lesions visible on pathogenic samples. The red rectangle in (B) indicates the type of saprophytic material used for analysis. To avoid that the majority of the fungal material had no direct contact to the wheat tissue, extensive aerial hyphae were stripped off the wheat head and only the intimately connected fungal cells were used for further analysis. (C) Infection rates were analyzed according to the published method (Brunner et al., 2009) by DNA-based and cDNA (RNA)-based quantitative PCR. The proportion of fungal chromosomal DNA (chrDNA) was determined within the total fungal/plant DNA mixture and the proportion of fungal mRNA (GAPDH cDNA) was determined within the total fungal/plant cDNA mixture. In the saprophytic samples basically no plant-derived DNA or mRNA was detectable any more already 3 dai. Patho, pathogenic growth on living wheat heads; sapro, saprophytic growth on cold-killed wheat heads.
Figure 3
Figure 3
Quantification of total DON/DON derivatives as well as butenolide and culmorin levels in different sample types and RT-qPCR analysis of key enzyme expression levels in respective SM gene clusters. (A) In planta cell extracts were analyzed for DON and its derivatives (15ADON, 3ADON, and DON-3-Glucoside) as well as for butenolide and culmorin 3 and 5 days after inoculation (dai). (B) Relative transcription levels normalized to β-tubulin transcription are shown for TRI5 (trichodiene synthase) and TRI6 (zinc finger transcription factor) of the core trichothecene biosynthesis cluster, FGSG_08079 (predicted cytochrome P450 benzoate 4- monooxygenase) and FGSG_08080 (putative regulatory protein containing a zinc finger motif) of the butenolide synthesis cluster and CLM1 encoding a longiborneol synthase necessary for culmorin biosynthesis. Levels were analyzed in planta during pathogenic (living plant) and saprophytic (dead plant) growth as well as in axenic cultures. Within the in planta samples expression levels of all tested genes on saprophytic material were arbitrarily set to 1 to allow direct comparison between these samples. For axenic samples, expression levels found on nitrate were arbitrarily set to 1 to allow comparisons of these in vitro samples. For all genes and conditions, comparative fold transcription levels are depicted on a logarithmic scale. (C) Filtrates of axenic cultivations on L- ornithine and nitrate harvested 3 dai were analyzed for DON and its derivatives (15ADON, 3ADON) as well as for butenolide and culmorin.
Figure 4
Figure 4
Selection of arginine biosynthesis as well as arginine and proline metabolism reactions from KEGG database whose underlying genes showed at least a two-fold up-regulation during pathogenic in comparison to saprophytic growth. Genes which underlie corresponding reaction numbers are shown in Table 1.
Figure 5
Figure 5
(A) Frequency distribution of genes counts showing certain log2(FPKM) values under the different growth conditions. (B) Venn diagram showing distribution of 65% highest expressed genes within the different growth conditions. Considering the proportion of 65% of highest expressed genes (8987 genes out of 13826 annotated) results in a log2(FPKM) threshold of 1.99 under pathogenic (patho), 2.46 under saprophytic (sapro), and 1.92 under axenic (axo) growth conditions.
Figure 6
Figure 6
Schematic illustration indicating which genes within secondary metabolite (SM) clusters of known products are expressed among the 65% of highest expressed genes within the respective growth condition (A,B) and detailed expression profile of the core TRI5 cluster genes (TRI8- TRI14), the three co- regulated genes (OrfC, OrfB, OrfA) as well as of the external located TRI1 and TRI101 genes (C). Horizontal fields in (A) and (B) represent one gene within the respective SM cluster. FGSG numbers (and partly gene names) are indicated for the core trichothecene, the butenolide as well as the culmorin gene clusters in (A). Gray indicates expression above the log2(FPKM) thresholds demarcated by the 65% of highest expressed genes within the respective growth condition, which are 1.99 in case of pathogenic (patho), 2.46 in case of saprophytic (sapro), and 1.92 in case of axenic (axo) growth. P.o.i.p.pigment, precursor of insoluble perithecial pigment, designating cluster C53 (Sieber et al., 2014).
Figure 7
Figure 7
Graphical illustration of considerations underlying the active plant (AP), passive plant (PP), and DON inducing (DI) categories which describe the main impact factors driving activation or repression of a certain gene. In our experimental set-up we had three growth conditions: Pathogenic (patho), saprophytic (sapro), and axenic minimal media supplemented with the DON inducing nitrogen source L-ornithine (axo). Taking a minimal differential expression of four-fold between the red and orange circled conditions in account, we calculated the affiliation of a certain gene to the AP, PP, or DI categories according to following principles: In case of genes mostly regulated by the AP impact factor, transcription in the patho sample is either high and both axo and sapro are low (AP up-regulated) or transcription in the patho sample is low and both axo and sapro are high (AP down-regulated). In case of the PP impact factor we assume that plant material is present in both patho and sapro samples. PP up-regulated genes are therefore given if transcription in both patho and sapro samples is high and under axo condition transcription is low; vice versa PP down-regulated genes show low transcription during patho and sapro conditions but high transcription in the axo sample. Regarding DI regulated genes the patho and axo conditions have in common their DON inducing ability in addition to the limited nitrogen supply as L-ornithine was already used up in axo and intact cell walls of the defending plant restrict free nutrient access, all in contrast to the sapro condition. Therefore, genes are up-regulated by the DI impact factor if transcription in axo and patho is high but in sapro low and if transcription levels in axo and patho are low but in sapro high, genes are DI down-regulated. That means generally if two samples are similar but different from the third sample the given gene falls into one of the categories AP, PP, or DI. In case of the intersections transcription levels within all three samples are different from each other. In each case there is an intermediate level for one condition and due to this less pronounced differences in gene response we have not further considered these gene sets for further analysis. Based on these considerations a gene can exclusively fall only once in one of the specified categories. groups within the AP, PP, DI, or AP∩PP, AP∩DI, PP∩DI categories.
Figure 8
Figure 8
Venn diagram showing number of genes which are at least four-fold differentially regulated between pathogenic, saprophytic and axenic L-ornithine supplemented growth conditions and could be assigned exclusively to active plant (AP), passive plant (PP), and DON inducing (DI) categories (p < 0.01) (A) and FunCat analysis of 184 exclusively AP up-regulated genes (B). In (A) the appendage “_up” indicates up- and the appendage “_down” stands for down-regulation by the respective impact factor.
Figure 9
Figure 9
Venn diagrams showing overlaps between active plant (AP) and passive plant (PP) up- (A) and down-regulated (B) gene sets with published datasets comprising exclusively wheat or wheat and barley induced genes (in planta publ.) as well as genes expressed exclusively in barley, complete or carbon and nitrogen starvation media or combined wheat/barley/media genes (others publ.).
Figure 10
Figure 10
Venn diagram showing overlaps between published in planta secreted proteins (Paper et al., 2007) and predicted genes coding for secreted proteins in the actual dataset which are up- regulated in the active plant (AP), passive plant (PP) and/or DON inducing (DI) categories.

Similar articles

Cited by

References

    1. Barra J. L., Mautino M. R., Rosa A. L. (1996). A dominant negative effect of eth-1r, a mutant allele of the Neurospora crassa S-adenosylmethionine synthetase-encoding gene conferring resistance to the methionine toxic analogue ethionine. Genetics 144, 1455–1462. - PMC - PubMed
    1. Bauer S., Gagneur J., Robinson P. N. (2010). GOing Bayesian: model-based gene set analysis of genome-scale data. Nucleic Acids Res. 38, 3523–3532. 10.1093/nar/gkq045 - DOI - PMC - PubMed
    1. Bendtsen J. D., Jensen L. J., Blom N., Von Heijne G., Brunak S. (2004). Feature-based prediction of non-classical and leaderless protein secretion. Protein Eng. Des. Sel. 17, 349–356. 10.1093/protein/gzh037 - DOI - PubMed
    1. Benjamini Y., Hochberg Y. (1995). Controlling the false discovery rate: a practical and powerful approach to multiple testing. J. R. Stat. Soc. B Methodol. 57, 289–300.
    1. Bluhm B. H., Zhao X., Flaherty J. E., Xu J. R., Dunkle L. D. (2007). RAS2 regulates growth and pathogenesis in Fusarium graminearum. Mol. Plant Microbe Interact. 20, 627–636. 10.1094/MPMI-20-6-0627 - DOI - PubMed