

Follicular helper T cell exhaustion induced by PD-L1 expression in hepatocellular carcinoma results in impaired cytokine expression and B cell help, and is associated with advanced tumor stages
- PMID: 27508013
- PMCID: PMC4969429
Follicular helper T cell exhaustion induced by PD-L1 expression in hepatocellular carcinoma results in impaired cytokine expression and B cell help, and is associated with advanced tumor stages
Abstract
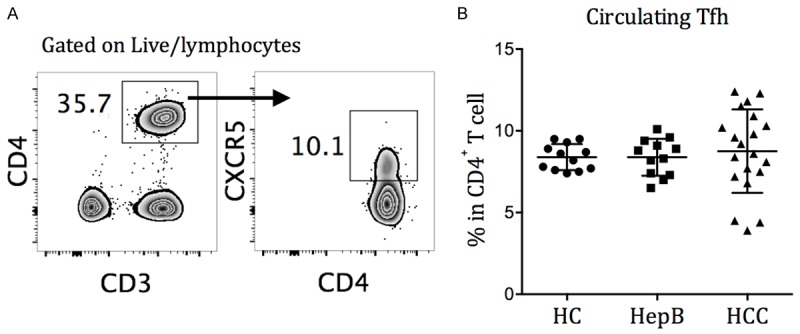
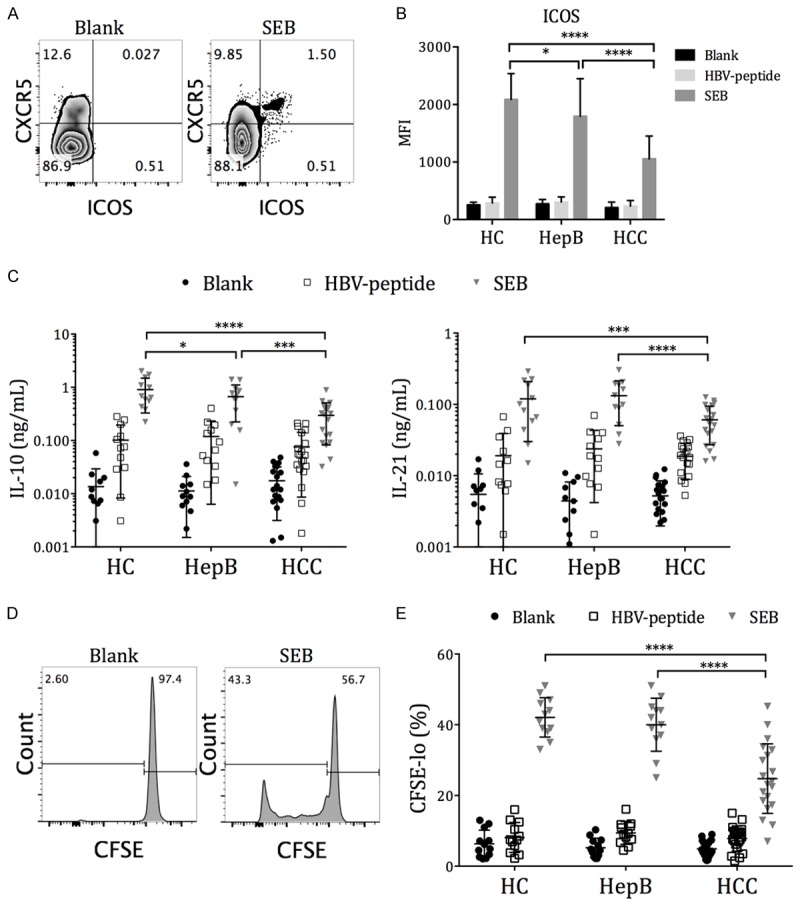
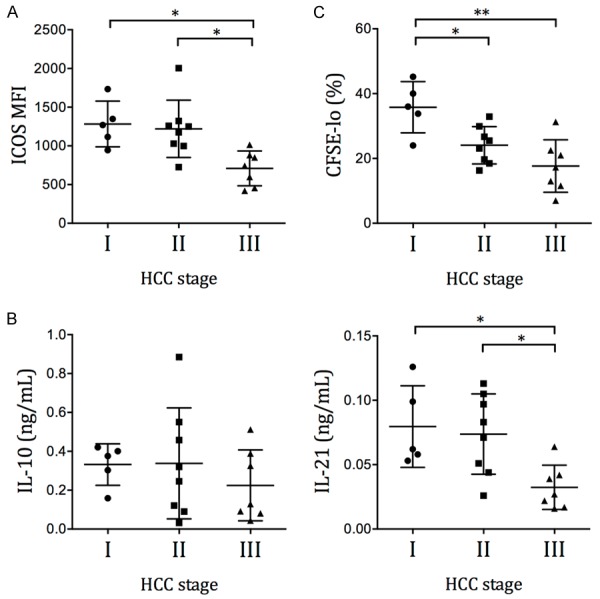
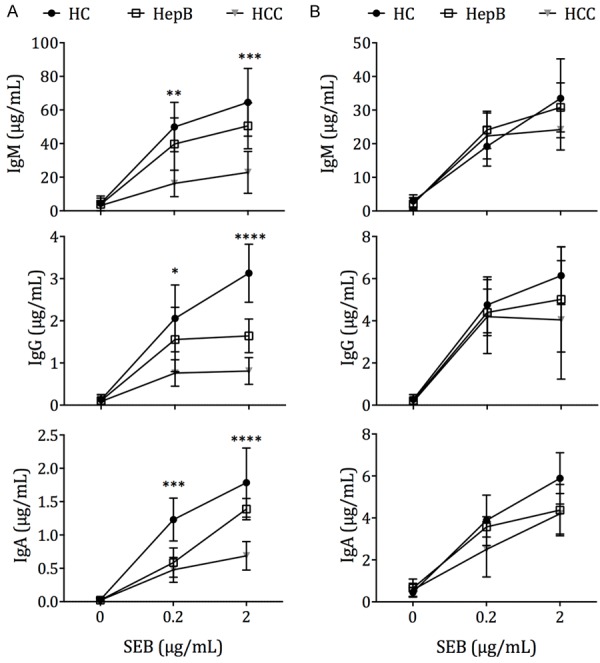
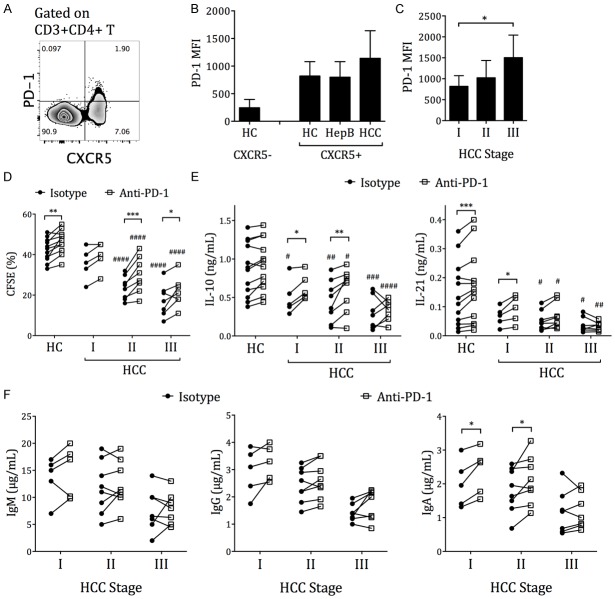
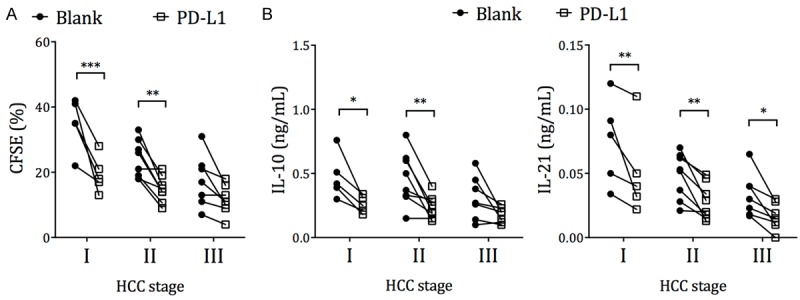
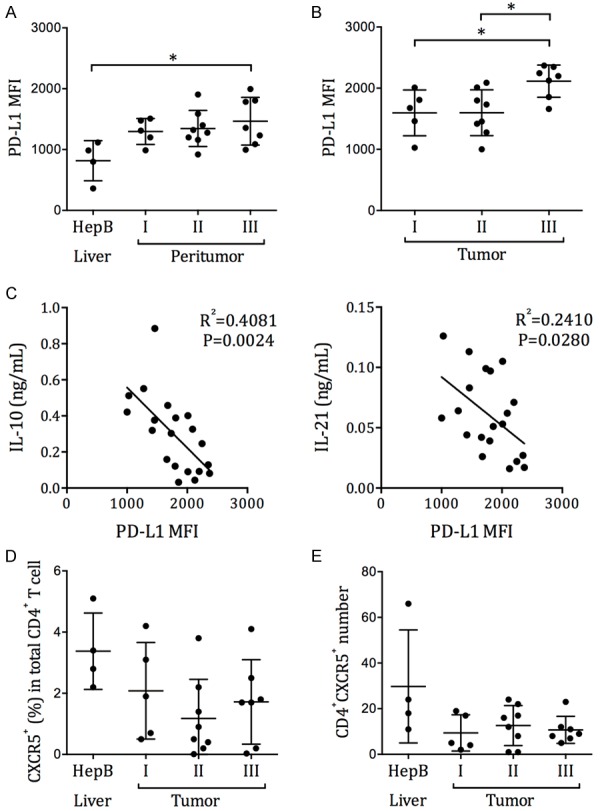
Hepatitis B virus (HBV)-related hepatocellular carcinoma (HCC) is one of the most common cancers in HBV-endemic regions, with irreversible progression and poor prognosis. HBV-related HCC patients lack effective antiviral/antitumor B cell antibody responses. We hypothesize that dysregulation of PD-1-expressing follicular helper T (Tfh) cell, induced by intrahepatic/intratumoral PD-L1 expression in HCC, could contribute to the defects in B cell immunity. The Tfh responses in healthy control (HC) subjects, chronic hepatitis B (HepB) patients, and HBV-related HCC patients were examined. Compared to HC and HepB individuals, HCC patients showed reduced ICOS expression, IL-10 and IL-21 secretion, and proliferation in Tfh cells. Tfh cells from stage III patients demonstrated increased impairment than those from stage I and stage II patients. Compared to Tfh cells from HC and HepB subjects, those from stage III HCC patients were significantly less effective at inducing the differentiation of naive B cells toward plasmablasts. HCC is known to upregulate hepatic PD-L1 expression, which could suppress Tfh responses. Blocking PD-1 partially rescued the Tfh functions in stage I and stage II HCC subjects but not in stage III HCC patients, while treatment with recombinant PD-L1 strongly suppressed Tfh functions in all HCC stages. Moreover, the level of IL-10 and IL-21 expression by Tfh cells was inversely correlated with the intensity of PD-L1 expression in resected tumors. Together, our results demonstrated an HCC-specific Tfh exhaustion, which might have resulted from elevated PD-1 and PD-L1 signaling.
Keywords: Follicular helper T cells; PD-L1; hepatocellular carcinoma.
Figures
Similar articles
-
Follicular helper T cells promote the effector functions of CD8+ T cells via the provision of IL-21, which is downregulated due to PD-1/PD-L1-mediated suppression in colorectal cancer.Exp Cell Res. 2018 Nov 1;372(1):35-42. doi: 10.1016/j.yexcr.2018.09.006. Epub 2018 Sep 8. Exp Cell Res. 2018. PMID: 30205088
-
Evidence of Interleukin 21 Reduction in Osteosarcoma Patients Due to PD-1/PD-L1-Mediated Suppression of Follicular Helper T Cell Functionality.DNA Cell Biol. 2017 Sep;36(9):794-800. doi: 10.1089/dna.2017.3669. Epub 2017 Jun 26. DNA Cell Biol. 2017. PMID: 28650673
-
Impaired function of CD4+ T follicular helper (Tfh) cells associated with hepatocellular carcinoma progression.PLoS One. 2015 Feb 17;10(2):e0117458. doi: 10.1371/journal.pone.0117458. eCollection 2015. PLoS One. 2015. PMID: 25689070 Free PMC article.
-
Role of TRAFs in Signaling Pathways Controlling T Follicular Helper Cell Differentiation and T Cell-Dependent Antibody Responses.Front Immunol. 2018 Oct 22;9:2412. doi: 10.3389/fimmu.2018.02412. eCollection 2018. Front Immunol. 2018. PMID: 30405612 Free PMC article. Review.
-
CD4 T Follicular Helper and Regulatory Cell Dynamics and Function in HIV Infection.Front Immunol. 2016 Dec 27;7:659. doi: 10.3389/fimmu.2016.00659. eCollection 2016. Front Immunol. 2016. PMID: 28082992 Free PMC article. Review.
Cited by
-
High MCM8 expression correlates with unfavorable prognosis and induces immune cell infiltration in hepatocellular carcinoma.Aging (Albany NY). 2022 Dec 27;14(24):10027-10049. doi: 10.18632/aging.204440. Epub 2022 Dec 27. Aging (Albany NY). 2022. PMID: 36575045 Free PMC article.
-
Comprehensive analysis of cuproptosis-related lncRNAs for prognostic significance and immune microenvironment characterization in hepatocellular carcinoma.Front Immunol. 2023 Jan 4;13:991604. doi: 10.3389/fimmu.2022.991604. eCollection 2022. Front Immunol. 2023. PMID: 36685508 Free PMC article.
-
NAFLD and HBV interplay - related mechanisms underlying liver disease progression.Front Immunol. 2022 Dec 5;13:965548. doi: 10.3389/fimmu.2022.965548. eCollection 2022. Front Immunol. 2022. PMID: 36544761 Free PMC article. Review.
-
PI3K/AKT/mTOR Pathway-Associated Genes Reveal a Putative Prognostic Signature Correlated with Immune Infiltration in Hepatocellular Carcinoma.Dis Markers. 2022 May 9;2022:7545666. doi: 10.1155/2022/7545666. eCollection 2022. Dis Markers. 2022. PMID: 35592706 Free PMC article.
-
Functionally impaired follicular helper T cells induce regulatory B cells and CD14+ human leukocyte antigen-DR- cell differentiation in non-small cell lung cancer.Cancer Sci. 2018 Dec;109(12):3751-3761. doi: 10.1111/cas.13836. Epub 2018 Nov 14. Cancer Sci. 2018. PMID: 30325558 Free PMC article.
References
-
- Xu C, Zhou W, Wang Y, Qiao L. Hepatitis B virus-induced hepatocellular carcinoma. Cancer Lett. 2014;345:216–222. - PubMed
-
- Llovet JM, Burroughs A, Bruix J. Hepatocellular carcinoma. Lancet. 2003;362:1907–1907. - PubMed
-
- Kao JH, Chen DS. Global control of hepatitis B virus infection. Lancet Infect Dis. 2002;2:395–403. - PubMed
-
- Lok ASF, McMahon BJ. Chronic hepatitis B. Hepatology. 2007;45:507–539. - PubMed
-
- Guidotti LG, Ishikawa T, Hobbs MV, Matzke B, Schreiber R, Chisari FV. Intracellular inactivation of the hepatitis B virus by cytotoxic T lymphocytes. Immunity. 1996;4:25–36. - PubMed
LinkOut - more resources
Full Text Sources
Research Materials