. 2016 Aug 9;24(2):234-45.
doi: 10.1016/j.cmet.2016.07.012.

Loss of Function of GALNT2 Lowers High-Density Lipoproteins in Humans, Nonhuman Primates, and Rodents

Affiliations

Loss of Function of GALNT2 Lowers High-Density Lipoproteins in Humans, Nonhuman Primates, and Rodents

Sumeet A Khetarpal et al. Cell Metab. .

Abstract

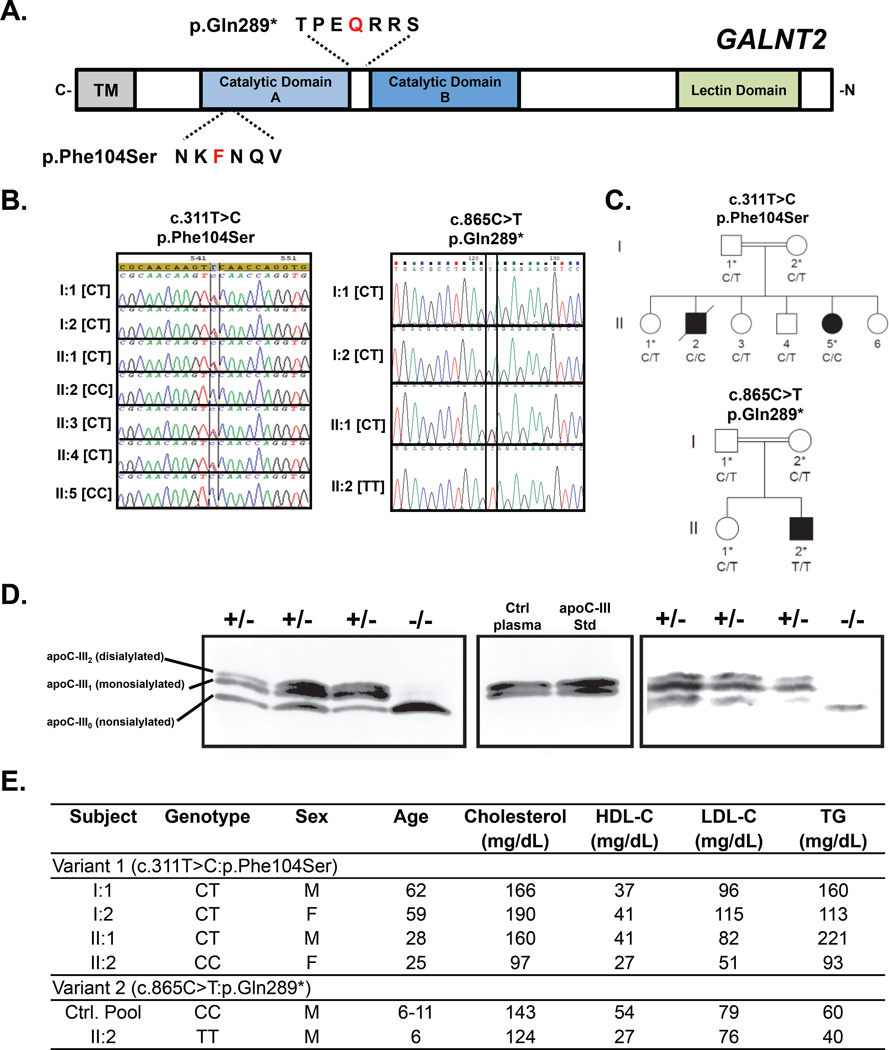
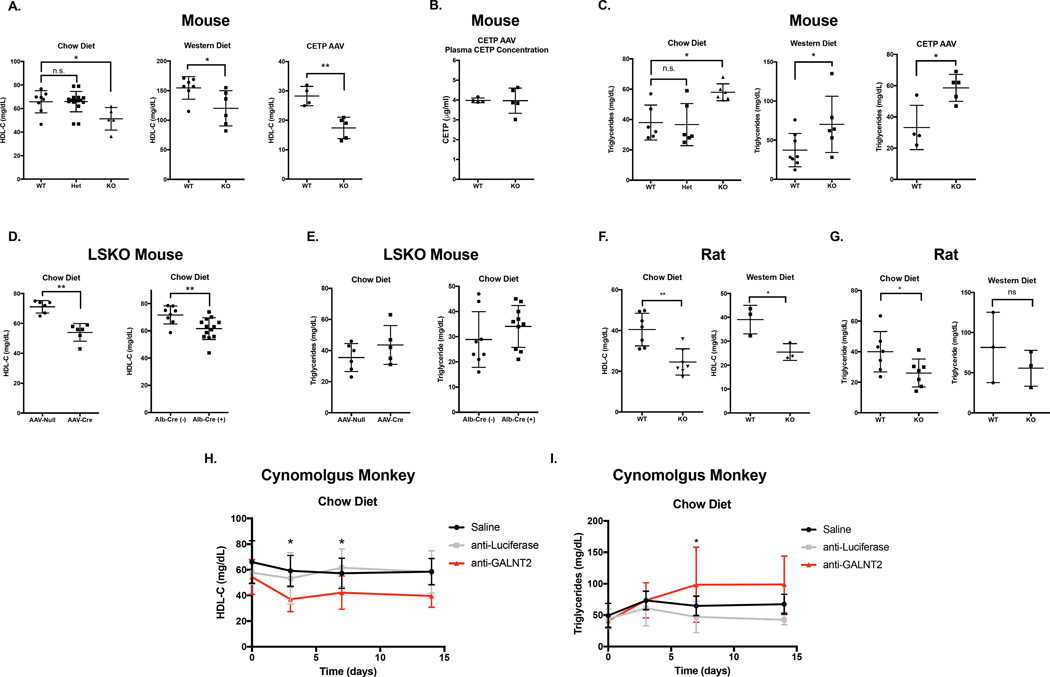
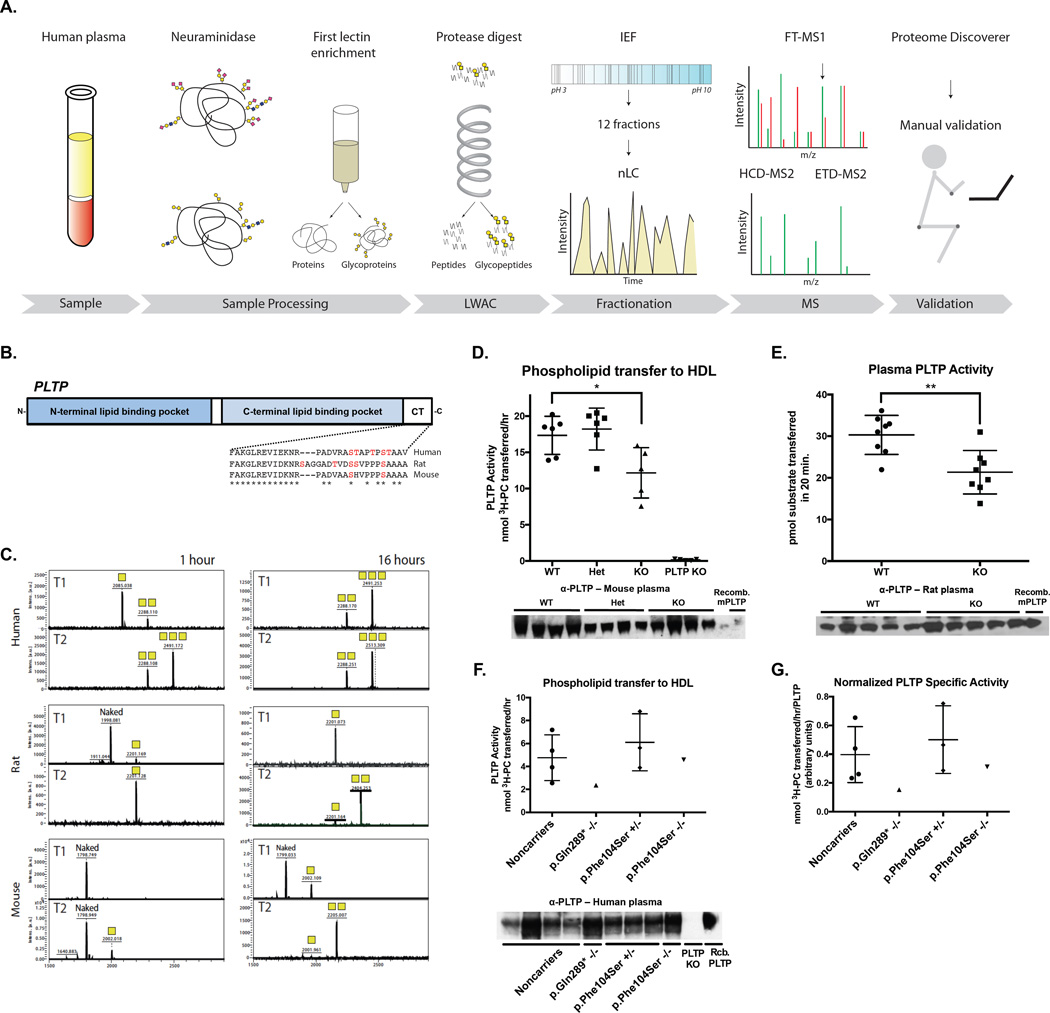
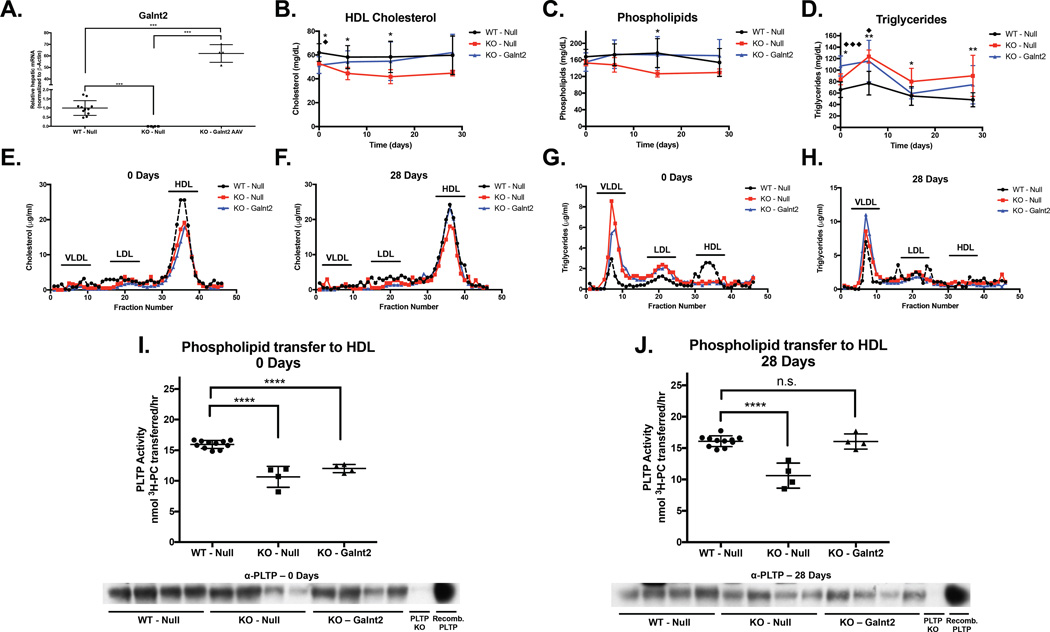
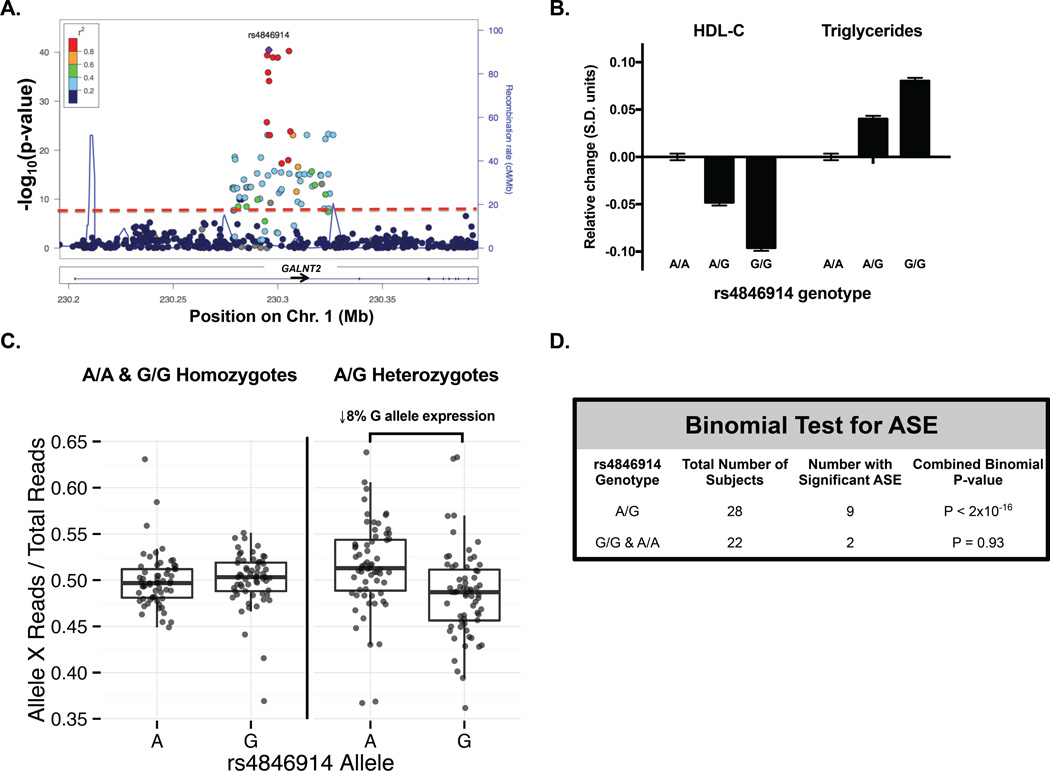
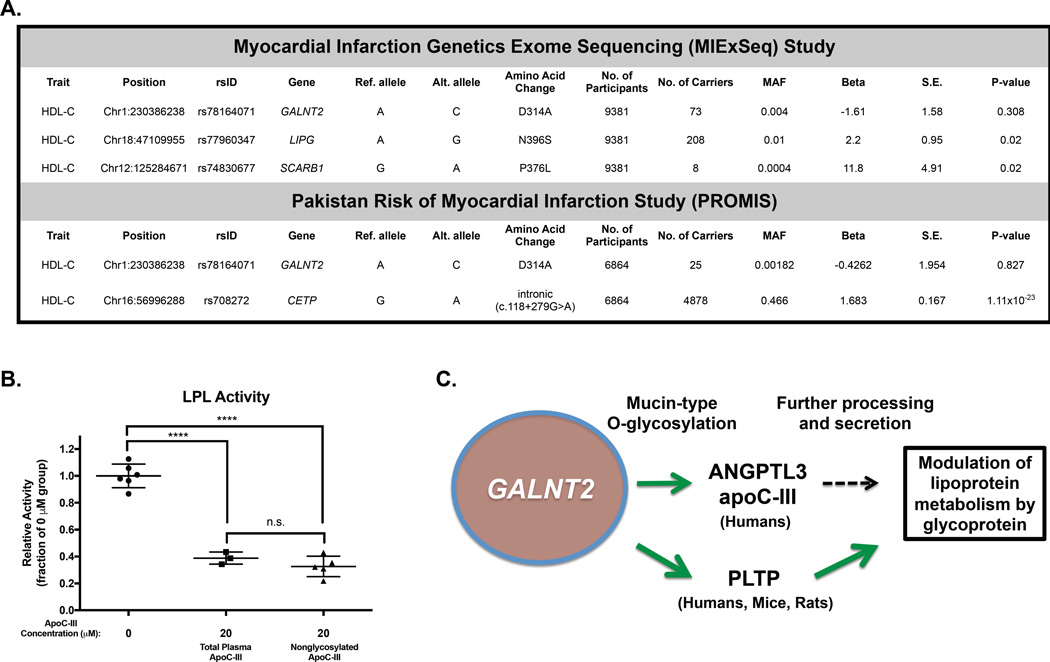
Human genetics studies have implicated GALNT2, encoding GalNAc-T2, as a regulator of high-density lipoprotein cholesterol (HDL-C) metabolism, but the mechanisms relating GALNT2 to HDL-C remain unclear. We investigated the impact of homozygous GALNT2 deficiency on HDL-C in humans and mammalian models. We identified two humans homozygous for loss-of-function mutations in GALNT2 who demonstrated low HDL-C. We also found that GALNT2 loss of function in mice, rats, and nonhuman primates decreased HDL-C. O-glycoproteomics studies of a human GALNT2-deficient subject validated ANGPTL3 and ApoC-III as GalNAc-T2 targets. Additional glycoproteomics in rodents identified targets influencing HDL-C, including phospholipid transfer protein (PLTP). GALNT2 deficiency reduced plasma PLTP activity in humans and rodents, and in mice this was rescued by reconstitution of hepatic Galnt2. We also found that GALNT2 GWAS SNPs associated with reduced HDL-C also correlate with lower hepatic GALNT2 expression. These results posit GALNT2 as a direct modulator of HDL metabolism across mammals.


Figures

Figure 1
Figure 1. Identification and lipid phenotype of human homozygotes with GALNT2 loss-of-function coding variants
A. Schematic GALNT2 protein showing position of the two identified variants, p.Phe104Ser and p.Gln289. B. Sanger sequencing of identified variants, c.C311T>C: p.Phe104Ser, and c.C865T: p.Gln289*. C. Pedigree of family members of probands for variants in A-B. Asterisk denotes individuals analyzed by ApoC-III immunoblot. D. Immunoblot of plasma ApoC-III from the probands and family controls for the GALNT2 variants. Migration positions of the 3 major ApoC-III isoforms, nonsialylated ApoC-III (ApoC-III0) lacking any O-glycan modification; monosialylated ApoC-III (ApoC-III1) containing N-acetylgalactosamine, galactose and 1 terminal sialic acid; and disialylated ApoC-III containing N-acetylgalactosamine, galactose, and 2 terminal sialic acids (ApoC-III2), are indicated on the left. E. Plasma lipids of GALNT2 variant carriers.
Figure 2
Figure 2. Plasma HDL cholesterol in mammalian models of GALNT2 loss-of-function
A. Plasma HDL-C after a 4 hour fast from Galnt2 WT, heterozygous (Het), and KO mice fed a chow diet (left), a chow diet after 4 weeks or administration of human CETP AAV (center), or a Western-type diet for 3 weeks (right). B. Plasma CETP concentration after 4 weeks in mice from (A, right). C. Plasma triglycerides in mice from (A). D. Plasma HDL-C from Galnt2 WT vs. liver-specific KO mice generated by AAV-Cre delivery in Galnt2fl/fl mice (left) or crossing Galnt2fl/fl with Alb-Cre transgenic mice (right). E. Plasma triglycerides in mice from (D). F. Plasma HDL-C after fasting for 12–16 hours from Galnt2 WT vs. KO rats fed a chow diet (left) or 6 weeks of Western-type diet (right). G. Plasma triglycerides in rats from (F). H. Plasma HDL-C after overnight fasting in cynomolgus monkeys (cyno) treated with saline, anti-luciferase siRNA or anti-GALNT2 siRNA. I. Plasma triglycerides in cyno monkeys from (H). Data is presented as mean values ± S.D.. * P<0.05, ** P<0.01, Student’s unpaired T-test.
Figure 3
Figure 3. Differential glycoproteomics of tissues from Galnt2 WT vs. KO rodents identifies PLTP as a candidate target of GalNAc-T2
A. Schematic of differential glycoproteomics approach to identify GalNAc-T2 targets from humans and rodent models. B. Phospholipid transfer protein (PLTP) schematic and cross-species alignment showing the C-terminal HDL-binding region. Asterisk shows conversed residues among mice, rats, and humans. Potential O-glycosylated residues (Ser and Thr) are indicated in red. C. In vitro glycosylation assay of PLTP C-terminal peptides by recombinant human GalNAc-T1 and –T2 over 1 hour and 16 hours. Yellow squares denote the number of GalNAc residues on each peptide. D. (Top) Plasma PLTP activity from Galnt2 WT, Galnt2 heterozygous (Het), Galnt2 KO (KO), and PLTP-deficient (PLTP KO) mice. (Bottom) Immunoblot of plasma PLTP from mice from activity assay above. E. (Top) Plasma PLTP activity from Galnt2 WT vs. KO rats. (Bottom) Immunoblot of plasma PLTP from rats from activity assay above. F. (Top) Plasma PLTP activity from human control subjects and homozygotes for GALNT2 nonsynonsymous variants. (Bottom) Immunoblot of plasma PLTP from human participants from PLTP activity assay above. G. Plasma PLTP specific activity from human participants in (F). Specific activity was measured as the plasma activity from (F Top) normalized to the densitometric intensity for the immunoblot from (F bottom). Where applicable, data is presented as mean values ± S.D.. ** P<0.01, ***P<0.001, Student’s unpaired T-test.
Figure 4
Figure 4. Reconstitution of hepatic Galnt2 expression in Galnt2 KO mice restores HDL-C and PLTP activity
A. Hepatic Galnt2 expression in WT mice transduced with Null AAV (WT – Null), Galnt2 KO mice transduced with Null AAV (KO – Null), and KO mice transduced with Galnt2 AAV (KO – Galnt2). ***P<0.001, Student’s unpaired T-test. B. Plasma HDL-C in mice from (A). C. Plasma phospholipids from mice in (A). D. Plasma Triglycerides from mice in (A). For B-D, significance was determined at each timepoint. *P<0.05, **P<0.01, Student’s unpaired T-test of comparison of WT – Null to KO – Null. ♦ P<0.05, ♦♦♦ P<0.001, Student’s unpaired T-test of comparison of WT -Null to KO – Galnt2. E. Day 0 cholesterol in fractions after FPLC separation from pooled plasma from each of the groups in (A). F. Day 28 cholesterol from FPLC fractions of pooled plasma from groups in (A). G. Day 0 triglycerides in FPLC fractions from pooled plasma from groups in (A). H. Day 28 triglycerides in FPLC fractions from pooled plasma from groups in (A). I. (Top) Plasma PLTP activity from Day 0 plasma from mice in (A). (Bottom) Immunoblot of plasma PLTP from PLTP activity assay above. J. (Top) Plasma PLTP activity from Day 28 plasma from mice in (A). (Bottom) Immunoblot of plasma PLTP from PLTP activity assay above. For I-J, ****P<0.0001, Student’s unpaired T-test for comparisons between the indicated groups. Data is presented as mean values ± S.D..
Figure 5
Figure 5. Common variants in GALNT2 associated with HDL-C confer allelic imbalance of GALNT2 expression in human liver
A. Manhattan plot of association of GALNT2 SNPs with HDL-C from the Global Lipids Genetics Consortium (GLGC) GWAS. Colors indicate the amount of linkage disequilibrium between plotted SNPs. Purple colored circle indicates lead SNP rs4846914 in GALNT2 intron 1. B. Relative change in HDL-C and TG (in S.E. units) per copy of rs4846914 allele from the GLGC GWAS. C. Allele-specific expression (ASE) of the rs4846914 SNP on GALNT2 expression from 72 human liver samples as measured by RNA-Seq. The fraction of GALNT2 reads arising from either the A or G allele for the rs4846914 SNP relative to total GALNT2 reads is plotted. Triangles indicate samples with significant ASE while circles indicate nonsignificant ASE. D. One-sided binomial test used to assess ASE for the distribution of GALNT2 transcripts arising from rs4846914 A vs. G allele in samples with A/A or A/G genotype for each sample. Data shows mean ± S.D..
Figure 6
Figure 6. Relationship of the previously reported D314A variant with HDL-C
A. Association of GALNT2 D314A with HDL-C in the MIExSeq rare variant association study (top) and the PROMIS study (bottom). For each association test, representative variants significantly associated with HDL-C for each respective study are given below the results for the GALNT2 D314A variant. Each study was 100% powered to detect a 1 S.D. change in HDL-C with significance level α=0.05. B. In vitro LPL activity in the presence of 0 µM ApoC-III, 20 µM total plasma ApoC-III, and 20 µM nonglycosylated ApoC-III. Data is shown as mean values ± S.D.. ****P<0.0001, Student’s unpaired T-test. C. Model for proposed targets of GALNT2 that modulate lipoprotein metabolism. Green lines show activating roles of GalNAc-T2 mediated O-glycosylation. Black dotted line indicates yet unclear regulatory effect of the glycosylation of indicated targets.

References

    1. Abou Jamra R, Wohlfart S, Zweier M, Uebe S, Priebe L, Ekici A, Giesebrecht S, Abboud A, Al Khateeb MA, Fakher M, et al. Homozygosity mapping in 64 Syrian consanguineous families with non-specific intellectual disability reveals 11 novel loci and high heterogeneity. European journal of human genetics : EJHG. 2011;19:1161–1166. - PMC - PubMed
    1. Albers JJ, Vuletic S, Cheung MC. Role of plasma phospholipid transfer protein in lipid and lipoprotein metabolism. Biochim Biophys Acta. 2012;1821:345–357. - PMC - PubMed
    1. Chatterjee C, Sparks DL. Hepatic lipase, high density lipoproteins, and hypertriglyceridemia. Am J Pathol. 2011;178:1429–1433. - PMC - PubMed
    1. Folkersen L, van’t Hooft F, Chernogubova E, Agardh HE, Hansson GK, Hedin U, Liska J, Syvanen AC, Paulsson-Berne G, Franco-Cereceda A, et al. Association of genetic risk variants with expression of proximal genes identifies novel susceptibility genes for cardiovascular disease. Circulation. Cardiovascular genetics. 2010;3:365–373. - PubMed
    1. Fritz TA, Raman J, Tabak LA. Dynamic association between the catalytic and lectin domains of human UDP-GalNAc:polypeptide alpha-N-acetylgalactosaminyltransferase-2. The Journal of biological chemistry. 2006;281:8613–8619. - PubMed

MeSH terms