

Functional Outcome Trajectories After Out-of-Hospital Pediatric Cardiac Arrest
- PMID: 27509385
- PMCID: PMC5129173
- DOI: 10.1097/CCM.0000000000002003
Functional Outcome Trajectories After Out-of-Hospital Pediatric Cardiac Arrest
Abstract
Objectives: To analyze functional performance measures collected prospectively during the conduct of a clinical trial that enrolled children (up to age 18 yr old), resuscitated after out-of-hospital cardiac arrest, who were at high risk of poor outcomes.
Design: Children with Glasgow Motor Scale score less than 5, within 6 hours of resuscitation, were enrolled in a clinical trial that compared two targeted temperature management interventions (THAPCA-OH, NCT00878644). The primary outcome, 12-month survival with Vineland Adaptive Behavior Scale, second edition, score greater or equal to 70, did not differ between groups.
Setting: Thirty-eight North American PICUs.
Participants: Two hundred ninety-five children were enrolled; 270 of 295 had baseline Vineland Adaptive Behavior Scale, second edition, scores greater or equal to 70; 87 of 270 survived 1 year.
Interventions: Targeted temperatures were 33.0°C and 36.8°C for hypothermia and normothermia groups.
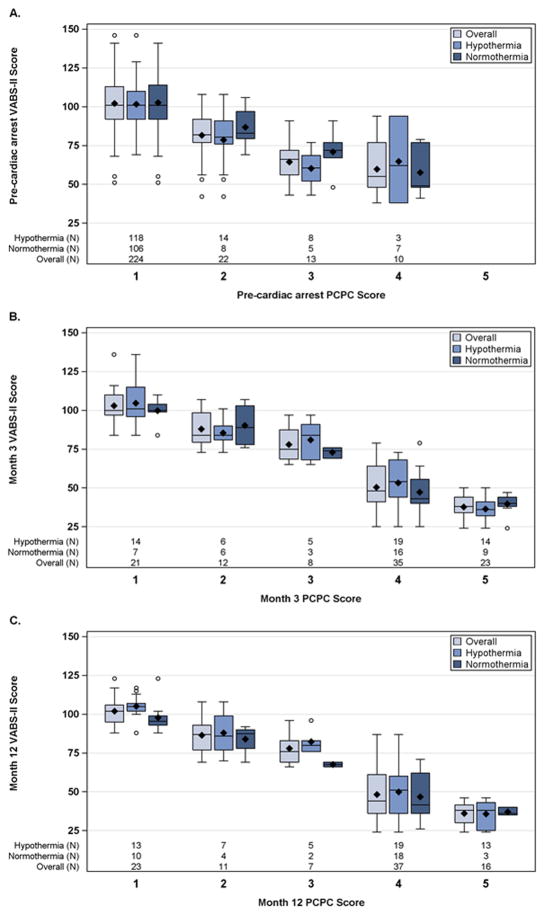
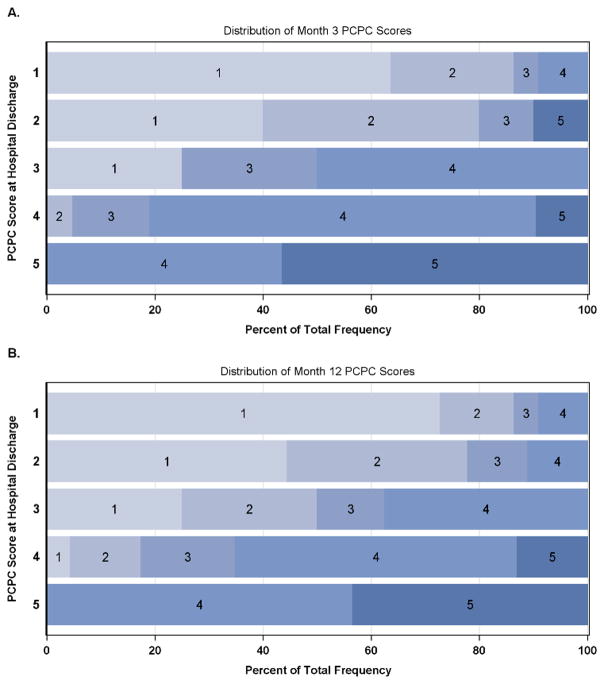
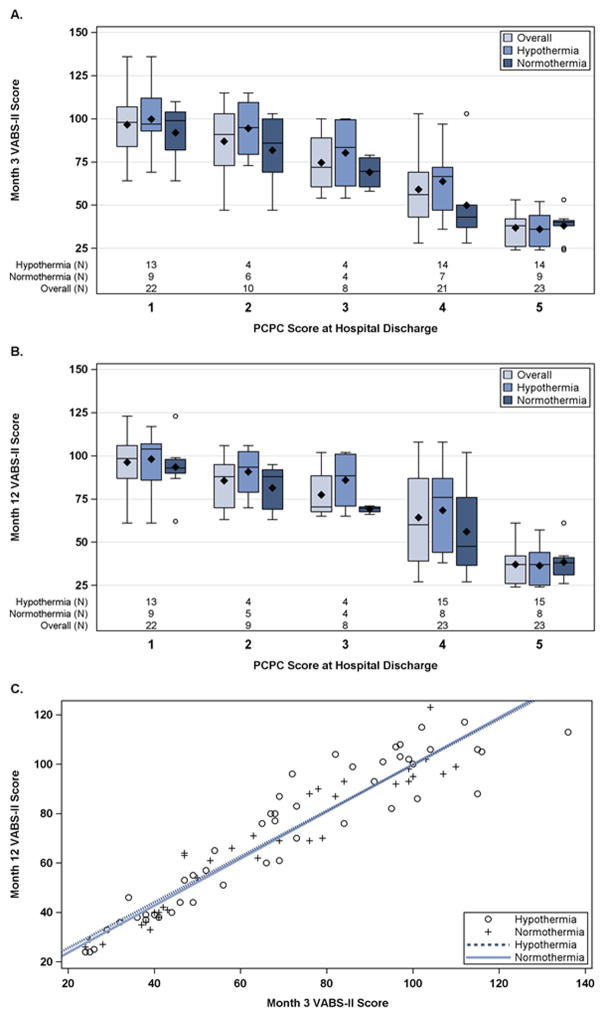
Measurements and main results: Baseline measures included Vineland Adaptive Behavior Scale, second edition, Pediatric Cerebral Performance Category, and Pediatric Overall Performance Category. Pediatric Cerebral Performance Category and Pediatric Overall Performance Category were rescored at hospital discharges; all three were scored at 3 and 12 months. In survivors with baseline Vineland Adaptive Behavior Scale, second edition scores greater or equal to 70, we evaluated relationships of hospital discharge Pediatric Cerebral Performance Category with 3- and 12-month scores and between 3- and 12-month Vineland Adaptive Behavior Scale, second edition, scores. Hospital discharge Pediatric Cerebral Performance Category scores strongly predicted 3- and 12-month Pediatric Cerebral Performance Category (r = 0.82 and 0.79; p < 0.0001) and Vineland Adaptive Behavior Scale, second edition, scores (r = -0.81 and -0.77; p < 0.0001). Three-month Vineland Adaptive Behavior Scale, second edition, scores strongly predicted 12-month performance (r = 0.95; p < 0.0001). Hypothermia treatment did not alter these relationships.
Conclusions: In comatose children, with Glasgow Motor Scale score less than 5 in the initial hours after out-of-hospital cardiac arrest resuscitation, function scores at hospital discharge and at 3 months predicted 12-month performance well in the majority of survivors.
Figures
References
-
- Mild therapeutic hypothermia to improve the neurological outcome after cardiac arrest. The Hypothermia After Cardiac Arrest Study Group. N Engl J Med. 2002;346:549–556. - PubMed
-
- Bernard SA, Gray TW, Buist MD, et al. Treatment of comatose survivors of out-of-hospital cardiac arrest with induced hypothermia. N Engl J Med. 2002;346:557–563. - PubMed
MeSH terms
Grants and funding
- UL1 TR000433/TR/NCATS NIH HHS/United States
- R21 HD044955/HD/NICHD NIH HHS/United States
- U54 HD079123/HD/NICHD NIH HHS/United States
- R34 HD050531/HD/NICHD NIH HHS/United States
- U01 HL094339/HL/NHLBI NIH HHS/United States
- U10 HD050012/HD/NICHD NIH HHS/United States
- UL1 TR001878/TR/NCATS NIH HHS/United States
- U10 HD049945/HD/NICHD NIH HHS/United States
- P30 HD040677/HD/NICHD NIH HHS/United States
- K23 NS075363/NS/NINDS NIH HHS/United States
- U10 HD049981/HD/NICHD NIH HHS/United States
- U10 HD050096/HD/NICHD NIH HHS/United States
- UL1 TR000003/TR/NCATS NIH HHS/United States
- U01 HL094345/HL/NHLBI NIH HHS/United States
- U10 HD049983/HD/NICHD NIH HHS/United States
- U01 HD049934/HD/NICHD NIH HHS/United States
- UL1 RR024986/RR/NCRR NIH HHS/United States
LinkOut - more resources
Full Text Sources
Other Literature Sources
