
A human neurodevelopmental model for Williams syndrome

Thanathom Chailangkarn et al. Nature. .

Abstract

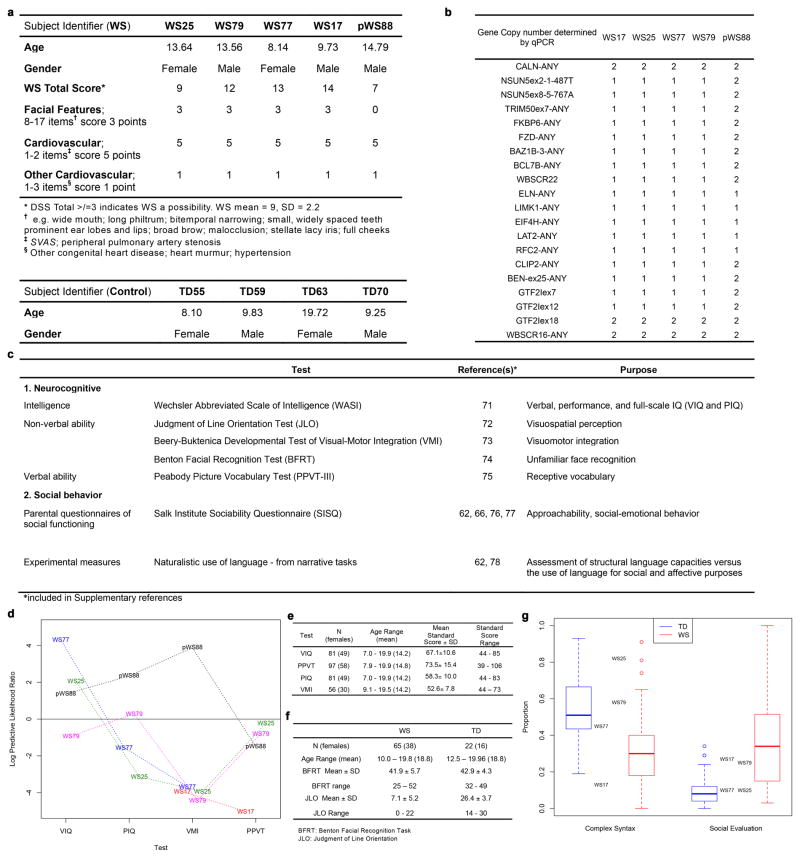
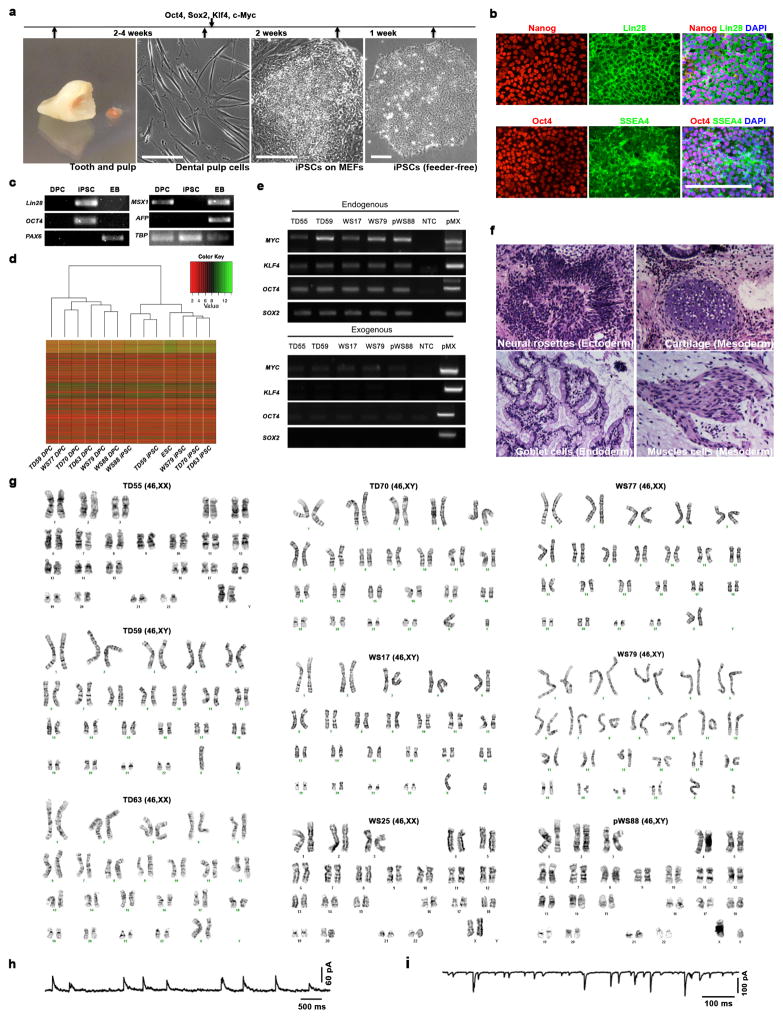
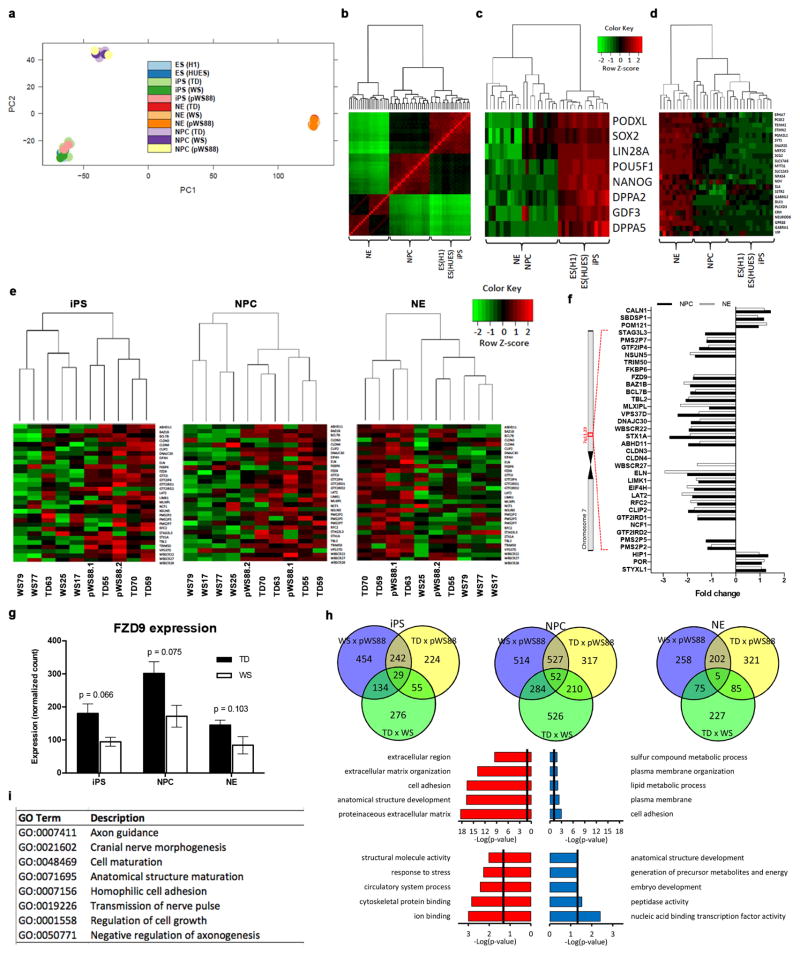
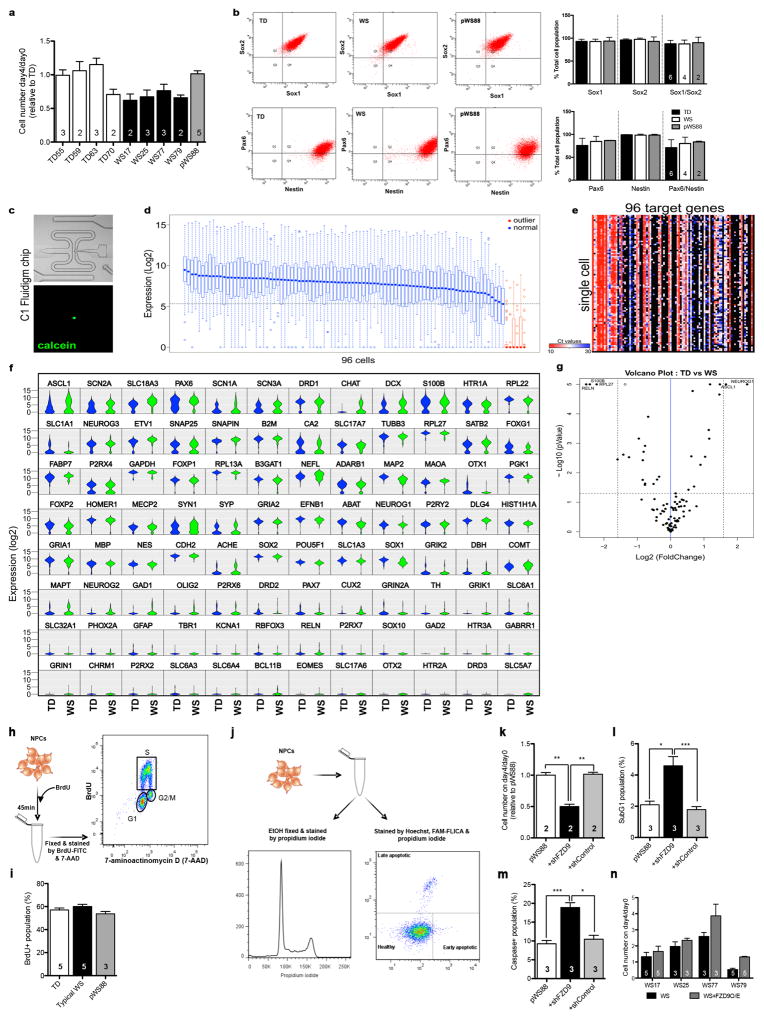
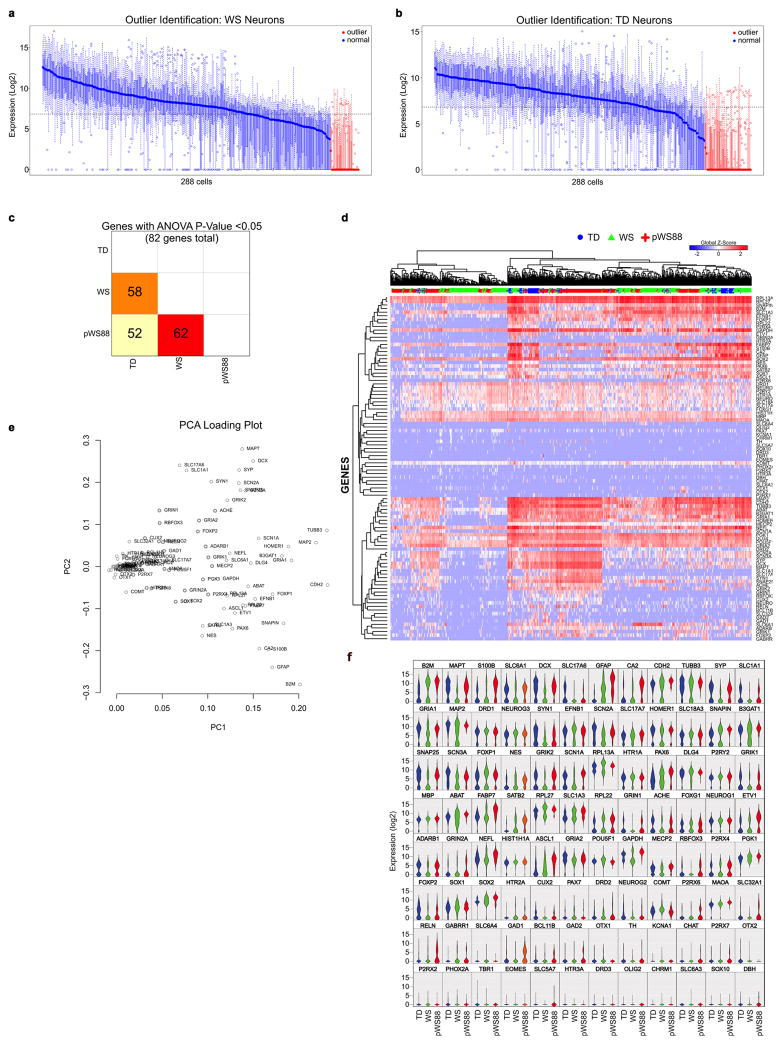
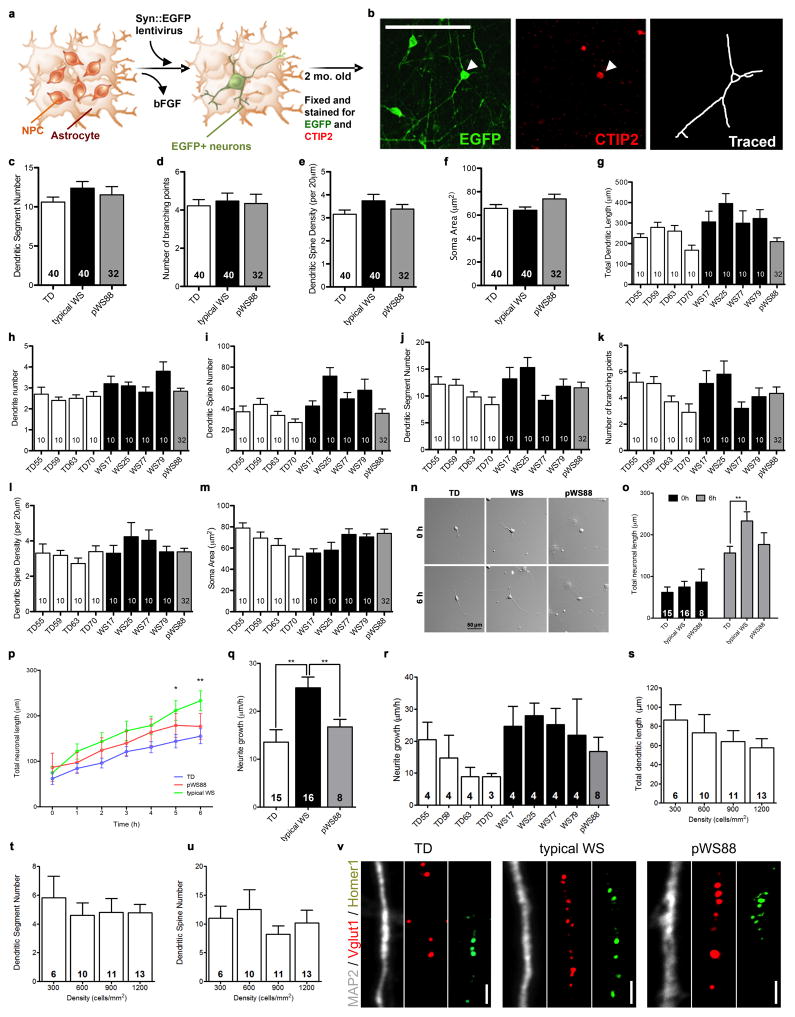
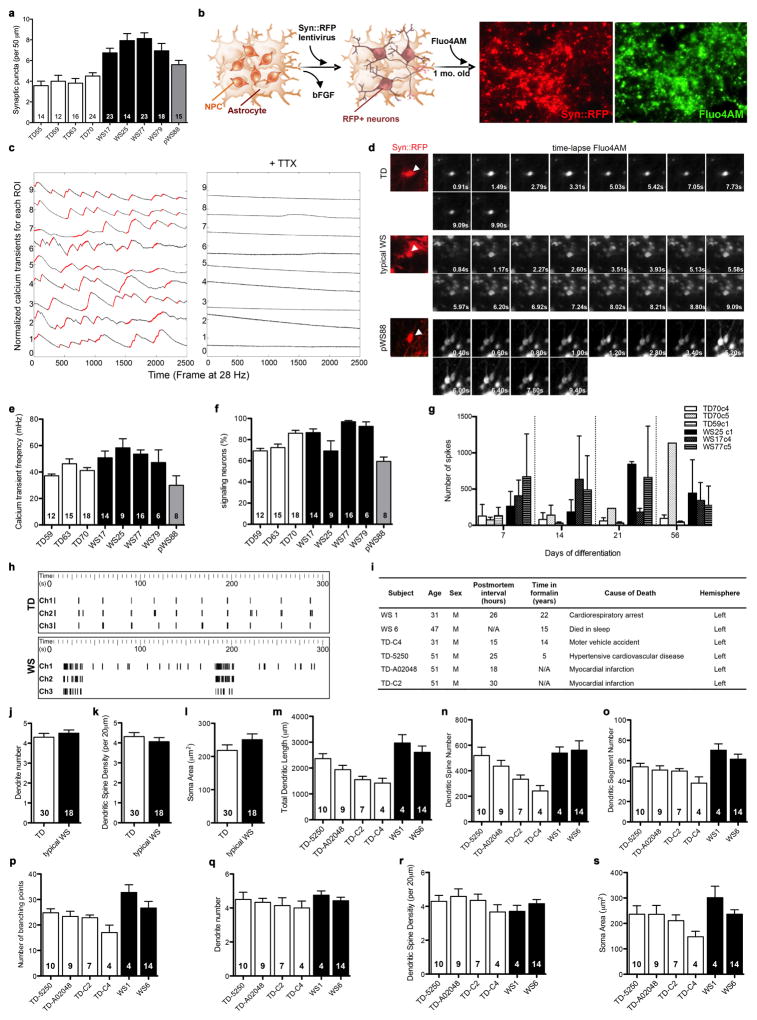
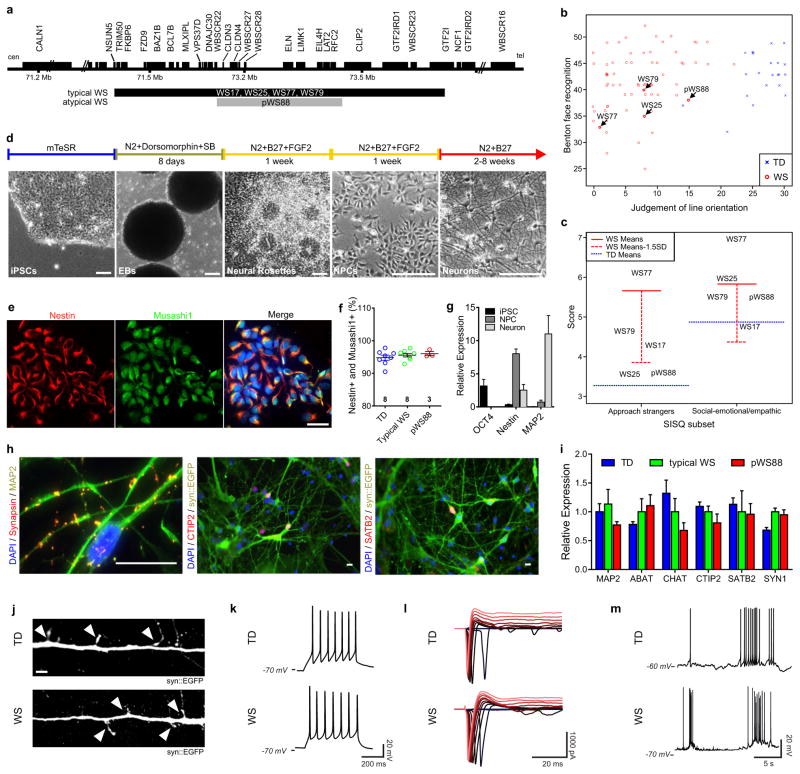
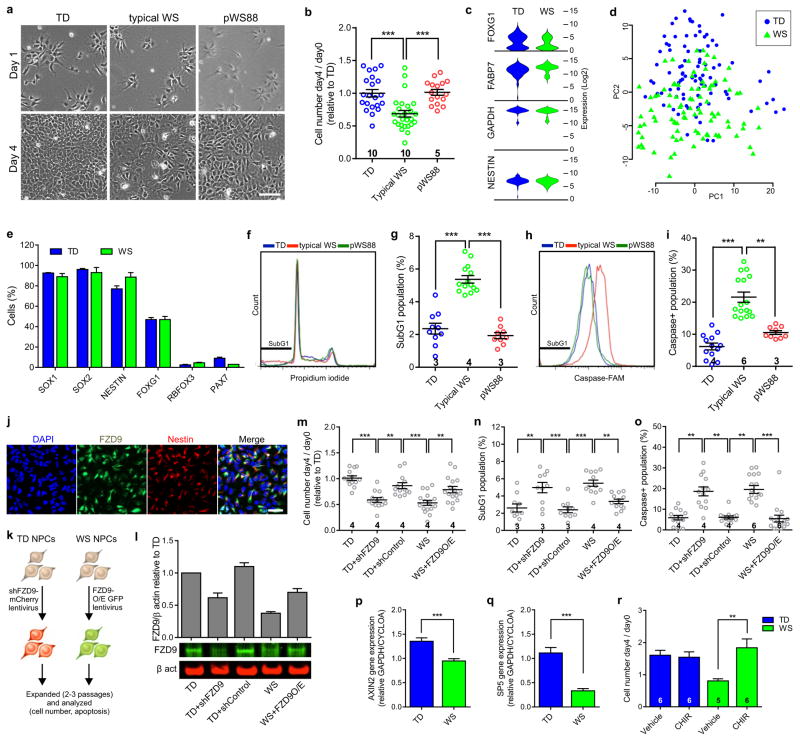
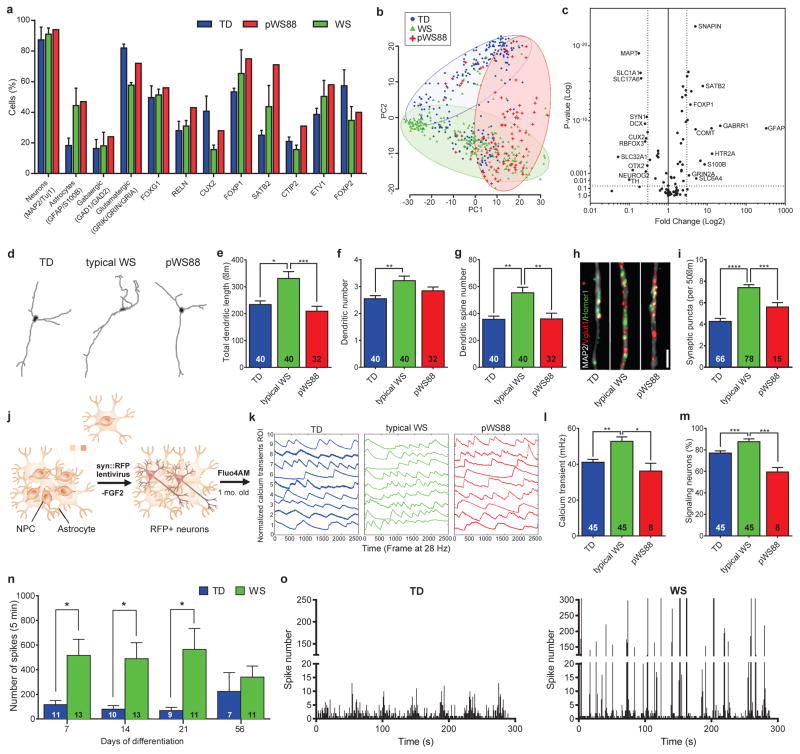
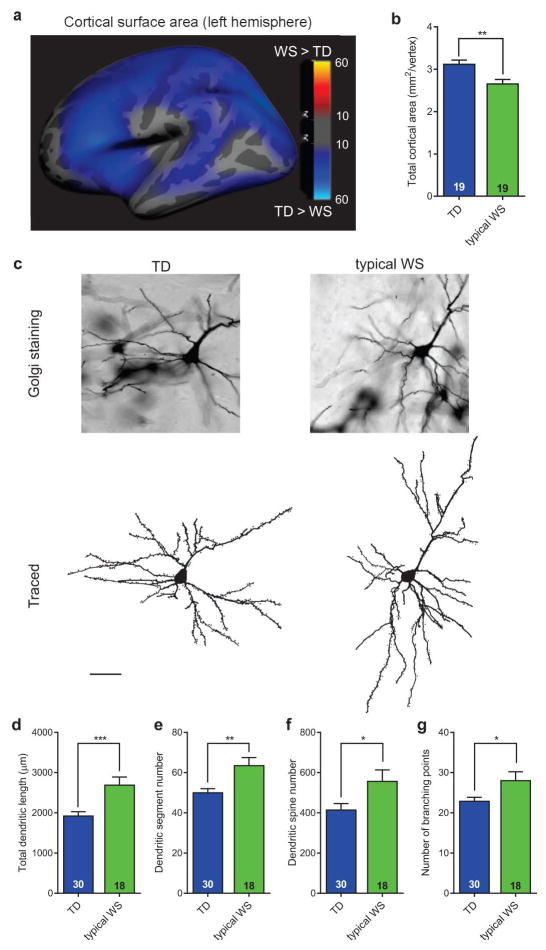
Williams syndrome is a genetic neurodevelopmental disorder characterized by an uncommon hypersociability and a mosaic of retained and compromised linguistic and cognitive abilities. Nearly all clinically diagnosed individuals with Williams syndrome lack precisely the same set of genes, with breakpoints in chromosome band 7q11.23 (refs 1-5). The contribution of specific genes to the neuroanatomical and functional alterations, leading to behavioural pathologies in humans, remains largely unexplored. Here we investigate neural progenitor cells and cortical neurons derived from Williams syndrome and typically developing induced pluripotent stem cells. Neural progenitor cells in Williams syndrome have an increased doubling time and apoptosis compared with typically developing neural progenitor cells. Using an individual with atypical Williams syndrome, we narrowed this cellular phenotype to a single gene candidate, frizzled 9 (FZD9). At the neuronal stage, layer V/VI cortical neurons derived from Williams syndrome were characterized by longer total dendrites, increased numbers of spines and synapses, aberrant calcium oscillation and altered network connectivity. Morphometric alterations observed in neurons from Williams syndrome were validated after Golgi staining of post-mortem layer V/VI cortical neurons. This model of human induced pluripotent stem cells fills the current knowledge gap in the cellular biology of Williams syndrome and could lead to further insights into the molecular mechanism underlying the disorder and the human social brain.


Conflict of interest statement

The authors declare no competing financial interests.

Figures

Extended Data Figure 1
Extended Data Figure 1. WS participants in iPSC study and their neurocognitive and social profiles
a, Summary of scores on the Diagnostic Score Sheet (DSS) for WS subjects. b, Table showing allele number of genes in WS-deleted region in each subject obtained from qPCR. c, Summary of all neurocognitive and social behavioral tests used on this study. d–e, WS neurocognitive profiles. Log predictive likelihood ratio for iPSC subjects (identified by subject number) calculated as the log of the ratio of the likelihoods for each individual test score based on the predictive distributions for TD and WS subjects (d). Values < 0 indicate depressed scores consistent with expectations for WS. Predictive distributions for TD subjects used published norms (means and standard deviations with assumed normality). Predictive distributions for WS subjects were calculated using available WS data (VIQ/PIQ n = 81, VMI n = 56, PPVT n = 97) (e), assuming normality and least squares estimation, and according to the procedures described elsewhere. WS parameter estimates for the VMI were calculated using censored regression due to a number of WS subjects scoring at the instrument floor. f, Description of population included in Benton Face Recognition and Judgment of Line Orientation in Figure 1b (TD n = 22 vs. WS n = 65). g, Boxplots for WS (red) and TD (blue) subjects on Complex Syntax (WS n = 45; TD n = 47) and Social Evaluation (WS n = 44; TD n = 49). Red and blue circles depict scores that are more than 1.5 times the inter-quartile range away from the median.
Extended Data Figure 2
Extended Data Figure 2. Generation and characterization of iPSCs
a, Diagram summarizing reprogramming protocol using retrovirus carrying Yamanaka transcription factors (see Supplementary Information for details). Scale bar, 200 μm. b, Representative images of iPSCs expressing pluripotent markers including Nanog, Lin28, Oct4 and SSEA4 assessed by immunofluorescence staining. Scale bar, 200 μm. c, Expression of three germ layer markers in iPSC-derived embryoid bodies (EBs); PAX6 (ectoderm), MSX1 (mesoderm) and AFP (endoderm) assessed by semi quantitative RT-PCR. TBP, housekeeping control. d, Cluster analysis showing correlation coefficients of microarray profiles of 3 WS dental pulp cells (DPCs), 3 TD DPCs, 3 WS iPSCs, 3 TD iPSCs and one ESCs. e, Representative PCR showing silencing of the four transgenes (exogenous) in iPSCs. f, Representative images of teratoma from iPSCs showing tissues of three germ layers; neural rosettes (ectoderm), cartilage (mesoderm), muscle cells (mesoderm) and goblet cells (endoderm). g, Representative image of iPSC chromosomes showing its genetic stability assessed by G-banding karyotype analysis. h–i, Spontaneous synaptic GABA events (h) and spontaneous synaptic AMPA events (i) in one-month-old iPSC-derived neurons.
Extended Data Figure 3
Extended Data Figure 3. Global gene expression analysis during neuronal differentiation
a, Principal component (PC) analysis plot of embryonic stem cells (ES), induced pluripotent stem cells (iPS), neuronal progenitor cells (NPC) and neurons (NE) for TD, WS and pWS88. c, Euclidian matrix distance-based heatmap and hierarchical clustering-based dendrogram of ES, NPC and NE cells for WD, WS and pWS88 samples. Expression variability between samples is indicated by Z-score, varying from green (negative variation) to red (positive variation). c, Euclidian matrix distance-based heatmap and hierarchical clustering-based dendrogram of pluripotency gene markers for ES, NPC and NE cells for TD, WS and pWS88 samples. d, Euclidian matrix distance-based heatmap and hierarchical clustering-based dendrogram of neuronal gene markers for iPS, NPC and NE cells for TD, WS and pWS88 samples. Expression variability between samples is indicated by Z-score, varying from green (negative variation) to red (positive variation). e, Specific cell type-based clustering analysis of biological replicates subjected to RNA-seq for the WS-related genes in three stages during differentiation (iPS, NPC and NE). f, Fold change variation of WS-related genes in different cell lines. Ideogram of chromosome 7 (band 7q11.23) corresponding to the commonly deleted region with the WS-related genes. Fold change variation of normalized WS-related gene expression in NPCs and neurons (NE) compared to TDs. Non-represented fold change corresponds to those genes having high expression variability between biological replicates, or having very low expression values. g, Expression of FZD9 gene in iPSC, NPCs and neurons from TD and WS. Error bars are represented by standard error. h, Venn diagram showing correlation of significant differentially expressed genes between TD, pWS88 and WS during neuronal differentiation. Significantly enriched GO terms found for down-regulated (red histogram) and up-regulated (blue histogram) differentially expressed genes between TD and WS in NPC. Significantly enriched GO terms found for down-regulated (red histogram) and up-regulated (blue histogram) differentially expressed genes between TD and WS in neurons (NE). Vertical line (black) corresponds to significant p-value (0.05). i, Enriched GO metabolic process terms found in NPC of WS samples correlated with the GO found by a similar comparison performed by Adamo et al. (2014).
Extended Data Figure 4
Extended Data Figure 4. Defect in WS NPC apoptosis and role of FZD9
a, Ratio of NPC number on day 4 over day 0 relative to TD. Data are shown as mean ± s.e.m. n = number of clones. b, High percentage (>95%) of Sox1/Sox2-positive and Pax6/Nestin-positive cell population was comparably observed in TD, typical WS and pWS88 NPCs assessed by FACS. Data are shown as mean ± s.e.m. n = number of clones. c, Microfluidics of C1 chip used to capture live single cells (calcein+ cell). d, Outliers exclusion based on the recommended/default LoD value 24, analyzed by Fluidigm Singular 3.0. Outliers were removed manually based on the sample median Log2Ex values. e, Representative example of non-normalized Ct Plot, indicated with the rectangle in the heat map. Cells are shown in rows and genes in columns. The range of cycle threshold (Ct) values is color coded from low (blue) to high (red) and absent (black). f, Violin plots of all 96 genes showing the comparison between TD and WS NPCs from the single cell analyses (Log2ex values). The majority of genes show unimodal expression distribution. g, Volcano plot of single-cell expression data. Plot illustrates differences in expression patterns of target genes of iPSC-derived NPCs. The dotted lines represent more than or equal to 3.0-fold differentially expressed genes between the groups at P<0.05 (unpaired two-sample t-test). h, Schematic diagram summarizing NPC preparation for proliferation assay and representative scatter plot showing cells in each cycle phase (G1, S and G2/M). i, No significant differences in percentage of the BrdU-positive population between TD, typical WS and pWS88 NPCs. j, Schematic diagram summarizing NPC preparation for apoptosis analysis and representative analyzed data for DNA fragmentation (left) and caspase assay (right). k–m, Changes in ratio of NPC number on day 4 over day 0 relative to TD (k), percentage of subG1 population (l) and percentage of population with high caspase activity (m) of pWS88 NPCs when treated with shFZD9 and shControl. n, Increase in cell number day 4/day 0 upon overexpression of FZD9 in WS iPSC-derived NPCs. Data are shown as mean ± s.e.m. for each individual. n = technical replicates. For i and k–m, data are shown as mean ± s.e.m. n = number of clones, *P<0.05, **P<0.01, ***P<0.001, one-way ANOVA and Tukey’s post hoc test (i), Kruskal-Wallis test and Dunn’s multiple comparison test (k–m).
Extended Data Figure 5
Extended Data Figure 5. Single-cell analysis of WS and TD iPSC-derived neurons
a–b, Outliers exclusion based on LoD = 24, analyzed by Fluidigm Singular 3.0. Outliers were removed manually based on the sample median Log2Ex values. c, Heatmap of number of genes with ANOVA P-value < 0.05 (82 genes in total). d, Unsupervised hierarchical clustering of 672 single-cell of WS and TD iPSC-derived neurons identified cell sub-populations not linked with the genotype. Cells are shown in rows and genes in columns. Log2- gene expression levels were converted to a global Z-score (blue is the lowest value and red is highest). Genes were clustered using the Pearson correlation method and cells were clustered using Euclidean method. e, PCA projections of the 96 genes, showing the contribution of each gene to the first two PCs. f, Violin plots of all 96 genes showing the comparison between TD, WS and pWS88 neurons from the single cell analyses (Log2ex values).
Extended Data Figure 6
Extended Data Figure 6. Morphometric analysis of WS-derived CTIP2-positive cortical neurons
a, Schematic diagram summarizing preparation of neurons for evaluation through morphometric analysis. b, Representative images of EGFP- and CTIP2-positive neuron (arrowhead) and tracing. Scale bar, 200 μm. c–f, No significant differences in dendritic segment numbers (c), number of branching points (d), dendritic spine density (e) and soma area (f) between TD, typical WS and pWS88 were observed. g–m, Morphometric analysis shown as individual subject for total dendritic length (g), dendritic tree number (h), dendritic spine number (i), dendritic segment number (j), number of branching points (k), dendritic spine density (l) and soma area (m). n, Four-weeks-old neurons were dissociated and plated to trace total neurite length every hour, in a total of 6 h. Representative images of traced neurons plated after 0 and 6 h from TD, typical WS and atypical pWS88 iPSC-derived neurons. o–r, Morphometric analysis showing significant differences among TD, typical WS and pWS88 in the initial neurite growth velocity (6h period). r, Morphometric analysis shown for individual subjects for neurite growth velocity for 6h interval. n = number of traced neurons. s–u, No significant changes were observed in the total dendritic length (s), dendritic segment number (t) and dendritic spine number (u) of TD neurons plated in different densities (3001200 cells/mm2). v, Individual channels of puncta quantification of post- and pre-synaptic markers (Homer1 / Vglut1). Scale bar, 2 μm. For c–m and o–u, data are shown as mean ± s.e.m. n = number of traced neurons, *P<0.05, **P<0.01, Kruskal-Wallis test (c–f), one-way ANOVA and Tukey’s post hoc test (oq, r–u).
Extended Data Figure 7
Extended Data Figure 7. Alteration in calcium transient in WS iPSC-derived neurons and morphometric analysis of cortical layer V/VI pyramidal neurons in postmortem tissue
a, Puncta quantification of post- and pre-synaptic markers. The synaptic proteins Vglut (pre-synaptic) and Homer1 (post-synaptic) were used as markers and only co-localized puncta on MAP2+ cells were quantified and graphed. Data are shown as the mean ± s.e.m. n = number of neurons. b, Schematic diagram summarizing preparation of neurons for calcium transient analysis. Representative images of live neuronal culture expressing RFP driven by synapsin promoter and the uptake of Fluo-4AM calcium dye. c, Blockade of calcium transient by TTX inhibition of synaptic activity. d, Representative images of calcium transient in single neurons (RFP-positive, arrowhead) from TD (top), typical WS (middle) and pWS88 (bottom). Number in the lower right of each figure represents each time point (second) when change in Fluo-4AM occurs. e–f, Calcium transient analysis shown as individual for frequency (e) and percentage of signaling neurons (f). Data are shown as mean ± s.e.m. n = number of fields analyzed. g, MEA analyses revealed an increase in spontaneous neuronal spikes. Data shows individual clones. i, Table showing subjects used for the analysis. h, Raster plot of TD and WS iPSC-derived neurons analyzed by multi-electrode array. i, Table showing subjects used for the analysis. j–l, No significant differences in dendrite number (j), dendritic spine density (k) and soma area (l) between TD and typical WS were observed. Data are shown as mean ± s.e.m. n = number of traced neurons, two-sided unpaired Student’s t test. m–s, Morphometric analysis shown for each individual for total dendritic length (m), dendritic spine number (n), segment number (o), branching point number (p), dendrite number (q), dendritic spine density (r) and soma area (s). Data are shown as mean ± s.e.m. n = number of traced neurons.
Figure 1
Figure 1. Characterization of participating individuals and iPSC differentiation
a, Diagram showing genes and deletion region of WS subjects. b, Scatter plot of Benton Face Recognition and Judgment of Line Orientation scores (jitter added) for n = 69 WS subjects and n = 22 TD subjects. c, Solid red lines depict mean test scores for WS (n = 101 for Approach Strangers; n = 100 for Social-emotional/empathic), and dotted blue lines depict mean test scores for TD (n = 80 for Approach Strangers; n = 79 for Social-emotional/empathic). d, Neural induction and neuronal differentiation protocol. Scale bar, 50 μm. e, Stage-specific protein expression in iPSC-derived NPCs. Scale bar, 50 μm. f, High percentage of Nestin and Musashi1-positive population was comparably observed in TD, typical WS and pWS88 NPCs by FACS. Data are shown as mean ± s.e.m. n = number of clones. g, Stage-specific markers for iPSC (OCT4), NPC (Nestin) and neuron (MAP2) by qPCR. h, Stage-specific protein expression in 6-week-old neurons. Scale bar, 25 μm. i, Expression of different neuronal markers in neurons indicating multiple neuronal subtypes in 6-week-old culture by qPCR. Data are shown as mean ± s.e.m. j, A representative image of neuronal protrusions (spine-like; arrowheads) from iPSC-derived neurons. Scale bar, 2 μm. k–m, 4-week-old TD and WS iPSC-derived neurons show evoked action potentials (k), evoked voltage-dependent sodium and potassium currents (l), and spontaneous bursts of action potentials (m).
Figure 2
Figure 2. Defect in apoptosis of WS-derived NPCs due to haploinsufficiency of FZD9
a, Representative images showing the difference in confluency between TD, typical WS and pWS88 iPSC-derived NPCs on day 4. Scale bar, 100 μm. b, Ratio of NPC number on day 4 over day 0 relative to TD. c, Violin plots of representative genes expressed in NPCs from single cell analyses. d, Principal component analysis (PCA) was used to compare the expression levels in individual cells based on the first two principal components. e, Percentage of cells expressing NPC, neuronal (RBFOX3) and neural crest (PAX7, contaminant population) related genes. WS and TD iPSC-derived NPCs show similar percentages of cells expressing target genes over defined Ct control value. f, Representative propidium iodide histogram showing an increase in subG1 population in typical WS NPCs. g, Percentage of subG1 population. h, Representative histogram showing an increase in caspase activity (caspase-FAM intensity) in typical WS NPCs. i, Percentage of population with high caspase activity. j, FZD9 protein expression in TD iPSC-derived NPCs. k, Schematic of FZD9 gain/loss of function experiments in NPCs. l, Expression level of FZD9 protein after treatment with shFZD9, shControl and FZD9 overexpression vectors, assessed by Western blot analysis. m–o, Ratio of NPC number on day 4 over day 0 relative to TD (m), percentage of subG1 population (n) and percentage of population with high caspase activity (o) when TD NPCs were treated with shFZD9 and shControl, and WS NPCs were overexpressed with FZD9. p–q, Significant decrease in expression of Axin2 (p) and SP5 (q) of WS NPCs compared to TDs. r, Rescue of WS NPC viability after CHIR98014 treatment. All data are shown as mean ± s.e.m. and n = number of clones. **P<0.01, ***P<0.001, Kruskal-Wallis test and Dunn’s multiple comparison test (b, g, i), one-way ANOVA and Tukey’s post hoc test (g, m–o), two-sided unpaired Student’s t test (p, q), two-sided unpaired Mann Whitney test (r).
Figure 3
Figure 3. Altered morphology of WS-derived cortical neurons and network activity
a, Percentage of cells expressing neural markers, neurotransmitter and cortical layer-related genes. WS, pWS88 and TD iPSC-derived neurons show non-significant percentage of cells expressing target genes over defined control Ct value. b, PCA of 672 cells projected onto the first two components. Overlaid populations of TD, pWS88 and WS neurons are shown. c, Volcano plot illustrates differences in expression patterns of target genes of iPSC-derived neurons from the single cell analyses. The dotted lines represent more than or equal to 3.0-fold differentially expressed genes between the groups at P<0.05 (unpaired Student’s t test). d, Representative images of tracings from TD, typical WS and atypical pWS88 iPSC-derived neurons (Syn::eGFP- and CTIP2-positive neurons). e–g, Morphometric analyses showing significant differences between TD, typical WS and pWS88 in total dendritic length (e), between TD and typical WS in dendrite number (f) and between TD, typical WS and pWS88 in dendritic spine number (g). h and i, Puncta quantification of post- and pre-synaptic markers. Scale bar, 2 μm. For e–g and i, data are shown as mean ± s.e.m. n = number of traced neurons. *P<0.05, **P<0.01, ***P<0.001, ****P<0.0001, Kruskal-Wallis test and Dunn’s multiple comparison test (e–g), one-way ANOVA and Tukey’s post hoc test (i). j, Schematic diagram summarizing preparation of neurons for calcium transient analysis. k, Representative images of the calcium tracing from iPSC-derived neurons. Fluorescence intensity changes reflecting intracellular calcium fluctuations in neurons in different Regions of Interest (ROI). l and m, Typical WS-derived neurons exhibited significant increase in calcium transient frequency (l) and percentage of signaling neuron in the culture (m) when compared to TD or pWS88 neurons. Data are shown as mean ± s.e.m. n = number of fields analyzed; 3198 neurons for TD, 4446 neurons for WS and 48 neurons for pWS88. *P<0.05, **P<0.01, ***P<0.001, Kruskal-Wallis test and Dunn’s multiple comparison test. n, MEA analyses revealed an increase in spontaneous neuronal spikes in WS during differentiation compared to TD. o, Although the number of total network bursts do not differ, WS shows a higher number of spikes in each burst compared to TD. Data are shown as mean ± s.e.m. n = number of MEA wells analyzed *P<0.05, **P<0.01, two-sided unpaired Student’s t test.
Figure 4
Figure 4. Neuroanatomical and morphological alterations in WS human brains
a, Statistical parametric map of the vertex-wise group differences between TD and WS in cortical surface area (left hemisphere shown) assessed by structural MRI scans. Color scales indicate the p-value for statistical test: blue indicates decrease; gray indicates no difference. The statistics are displayed on a template group-averaged cortical surface rendering of healthy adult subjects. b, Reduction in overall cerebral cortical surface area in WS. Data are shown as mean ± s.e.m. n = number of brains analyzed. **P<0.01, one-sided unpaired Student’s t test. c, Representative images of postmortem cortical layer V/VI pyramidal neurons using Golgi staining (top) and their corresponding tracing (bottom) from TD and WS. d–g, Morphometric analysis showing significant increases in total dendritic length (d), dendritic spine numbers (e), dendritic segment number (f) and number of branching points (g) in WS compared to TD postmortem cortical layer V/VI pyramidal neurons. Data are shown as mean ± s.e.m. n = number of traced neurons. *P<0.05, **P<0.01, ***P<0.001, two-sided unpaired Student’s t test (d), two-sided unpaired Mann Whitney test (e–g).

References

    1. Korenberg JR, et al. VI. Genome structure and cognitive map of Williams syndrome. Journal of cognitive neuroscience. 2000;12(Suppl 1):89–107. - PubMed
    1. Meyer-Lindenberg A, et al. Neural basis of genetically determined visuospatial construction deficit in Williams syndrome. Neuron. 2004;43:623–631. - PubMed
    1. Bellugi U, Lichtenberger L, Mills D, Galaburda A, Korenberg JR. Bridging cognition, the brain and molecular genetics: evidence from Williams syndrome. Trends in Neurosciences. 1999;22:197–207. - PubMed
    1. Bellugi U, Lichtenberger L, Jones W, Lai Z, St George MI. The neurocognitive profile of Williams Syndrome: a complex pattern of strengths and weaknesses. J Cogn Neurosci. 2000;12(Suppl 1):7–29. - PubMed
    1. Doyle TF, Bellugi U, Korenberg JR, Graham J. “Everybody in the world is my friend” hypersociability in young children with Williams syndrome. American Journal of Medical Genetics Part A. 2004;124A:263–273. - PubMed

Publication types

MeSH terms