. 2016 Aug 25;536(7617):431-436.
doi: 10.1038/nature19083. Epub 2016 Aug 10.

Molecular basis of APC/C regulation by the spindle assembly checkpoint

Affiliations

Molecular basis of APC/C regulation by the spindle assembly checkpoint

Claudio Alfieri et al. Nature. .

Abstract

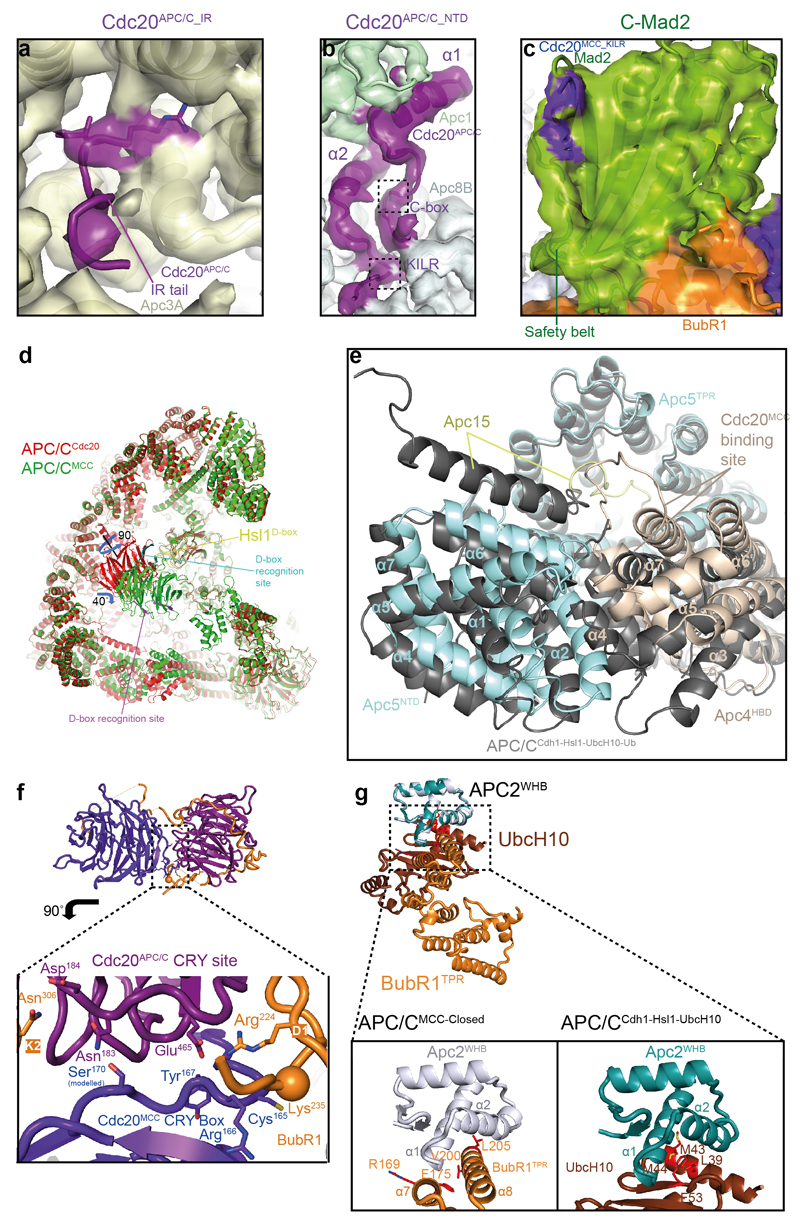
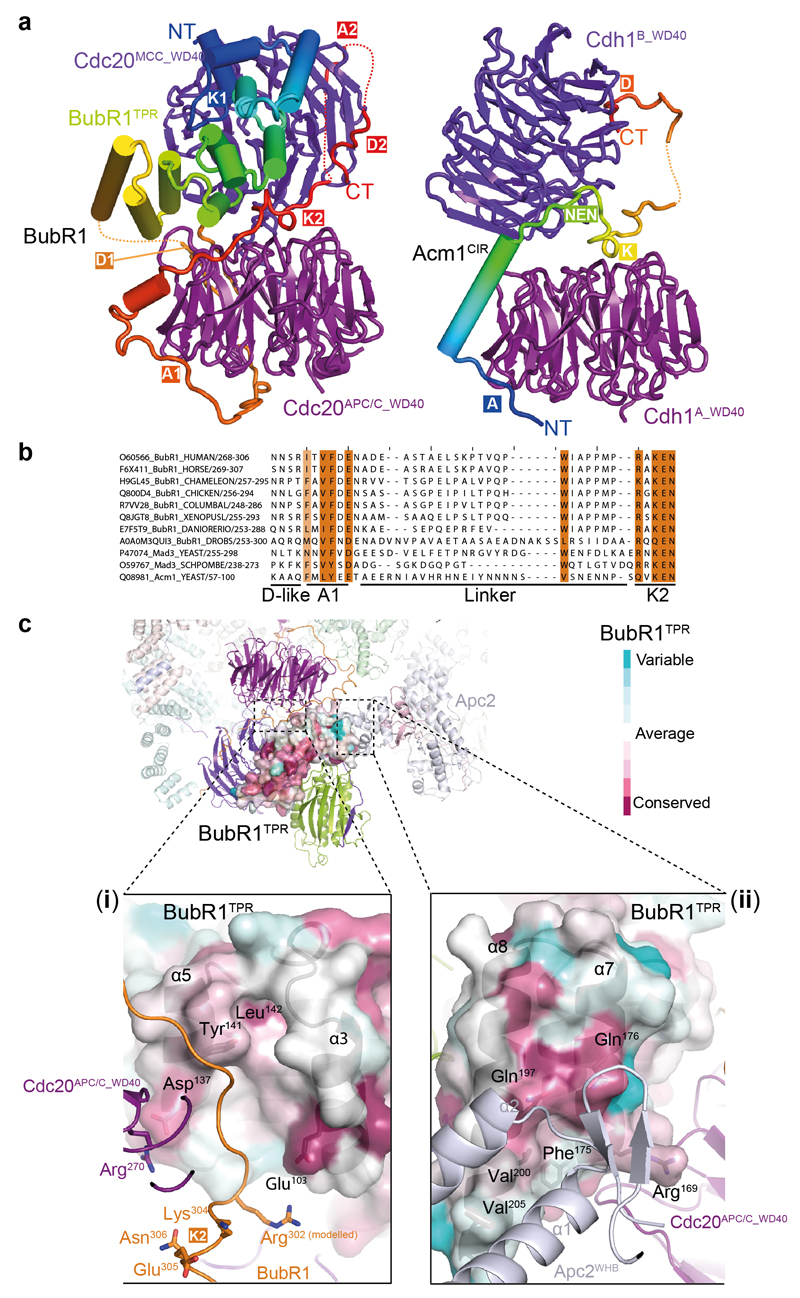
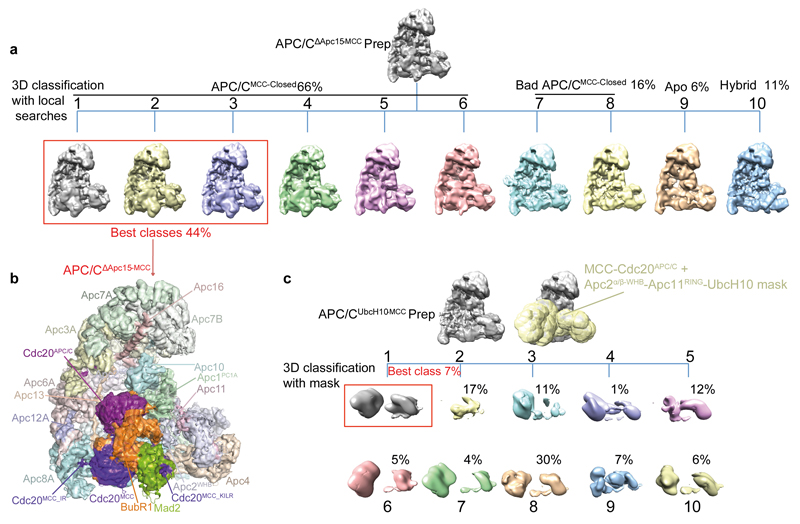
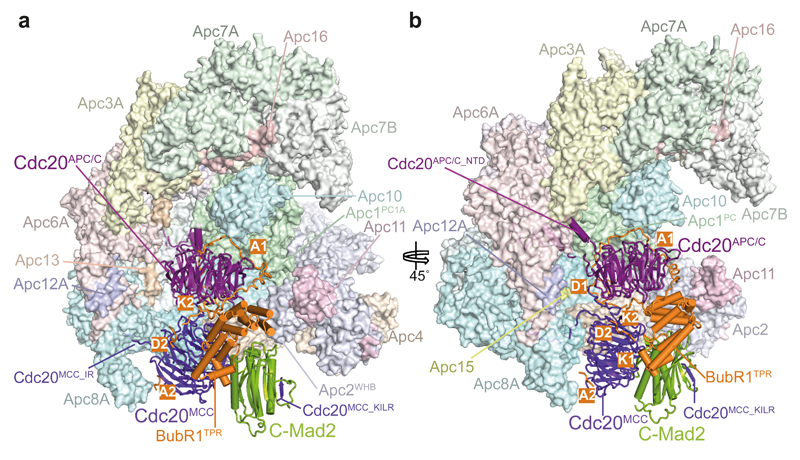
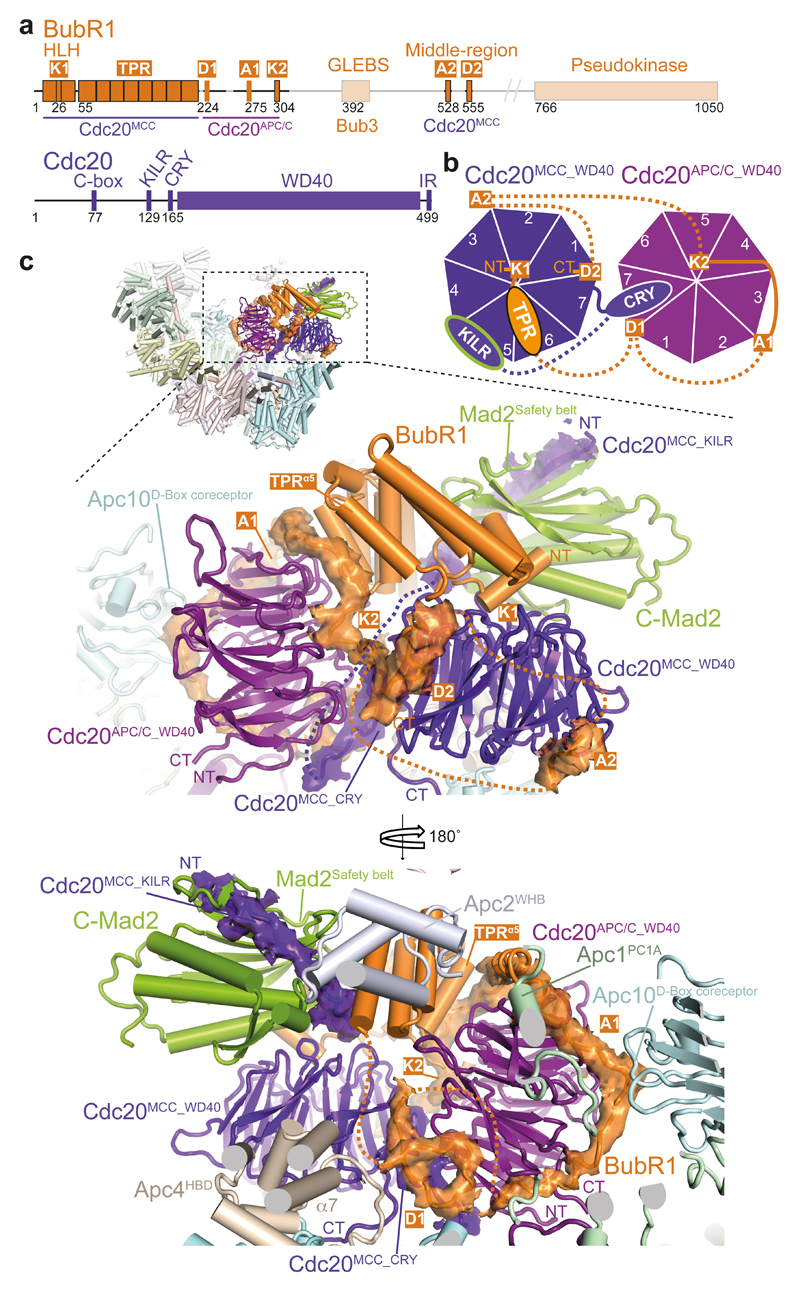
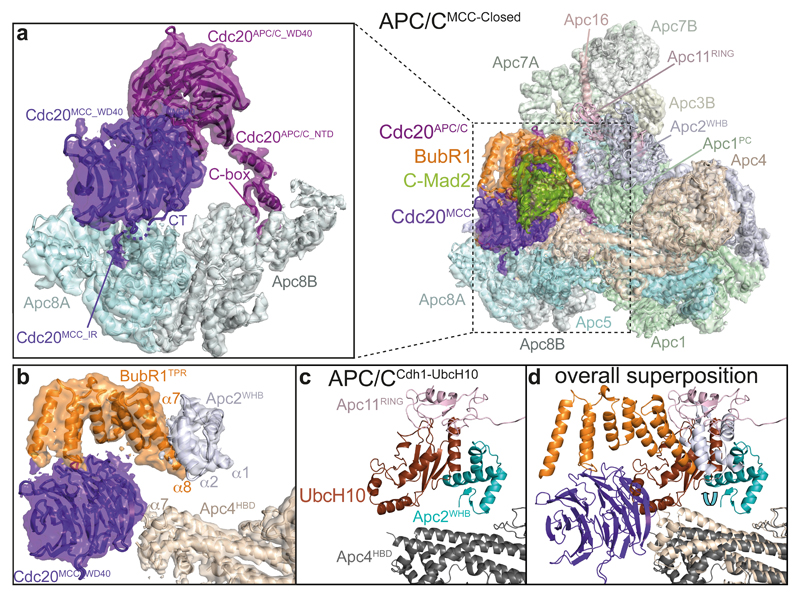
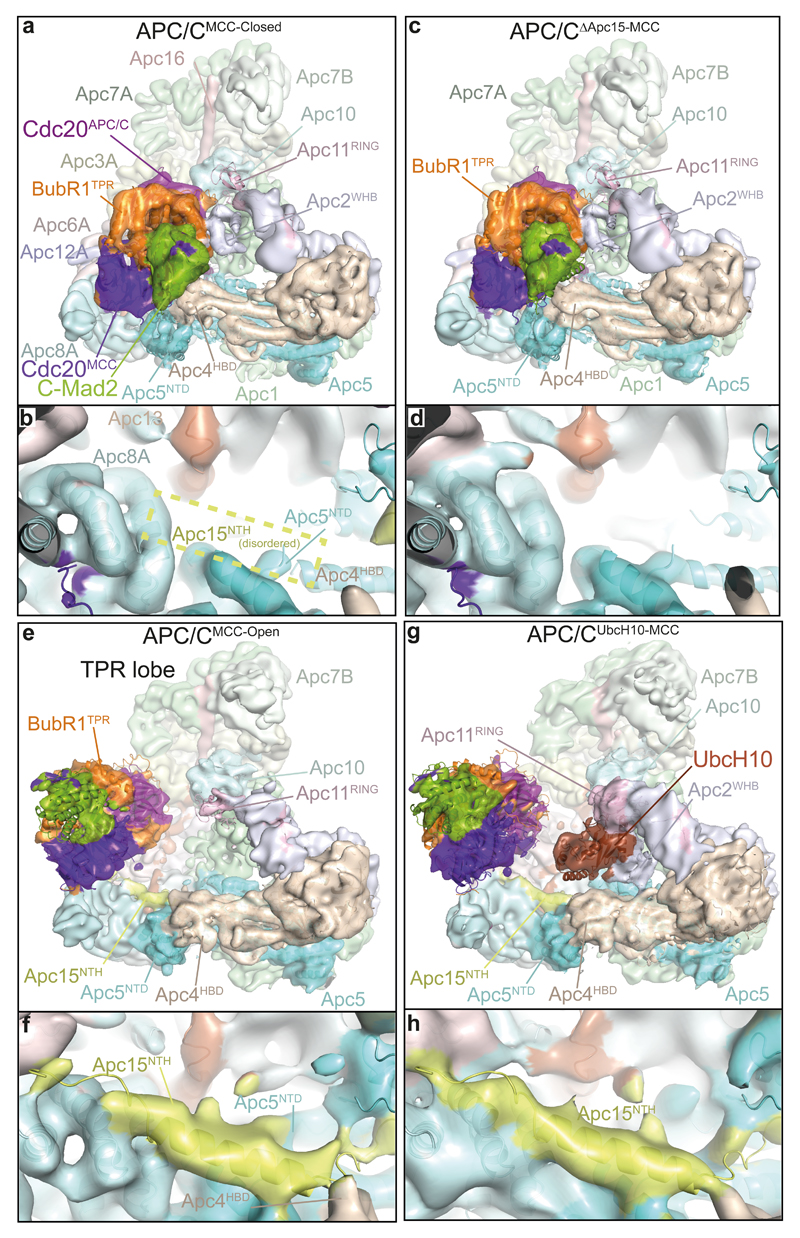
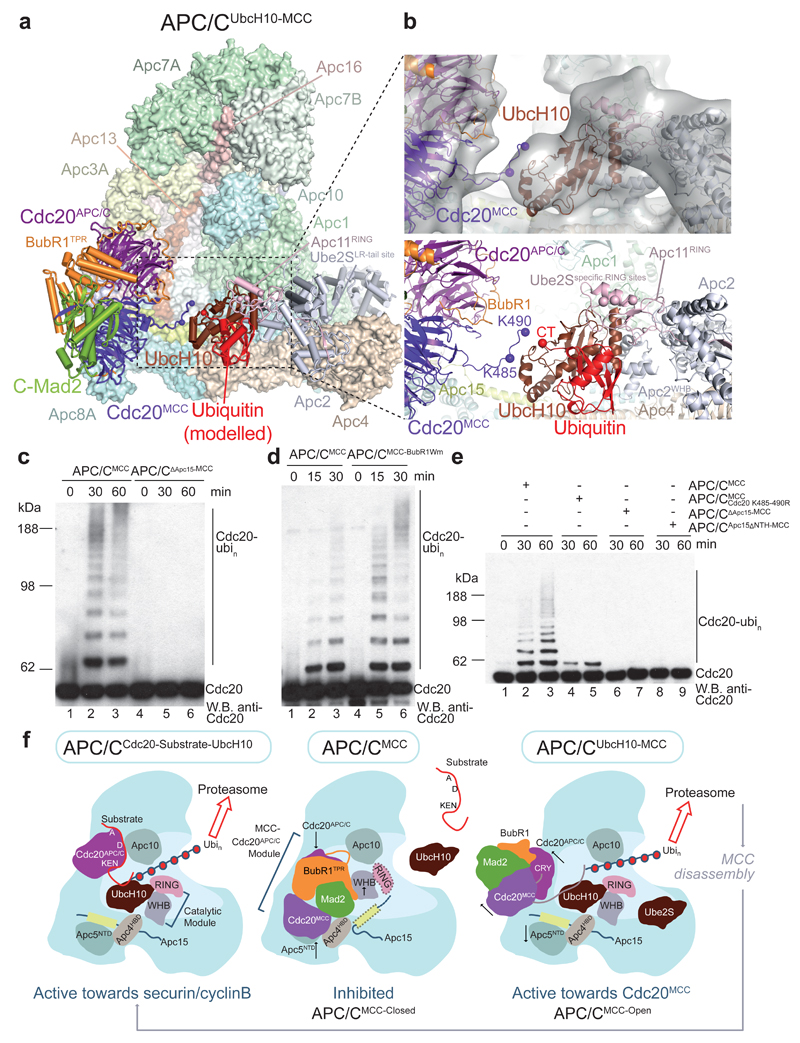
In the dividing eukaryotic cell, the spindle assembly checkpoint (SAC) ensures that each daughter cell inherits an identical set of chromosomes. The SAC coordinates the correct attachment of sister chromatid kinetochores to the mitotic spindle with activation of the anaphase-promoting complex (APC/C), the E3 ubiquitin ligase responsible for initiating chromosome separation. In response to unattached kinetochores, the SAC generates the mitotic checkpoint complex (MCC), which inhibits the APC/C and delays chromosome segregation. By cryo-electron microscopy, here we determine the near-atomic resolution structure of a human APC/C–MCC complex (APC/C(MCC)). Degron-like sequences of the MCC subunit BubR1 block degron recognition sites on Cdc20, the APC/C coactivator subunit responsible for substrate interactions. BubR1 also obstructs binding of the initiating E2 enzyme UbcH10 to repress APC/C ubiquitination activity. Conformational variability of the complex enables UbcH10 association, and structural analysis shows how the Cdc20 subunit intrinsic to the MCC (Cdc20(MCC)) is ubiquitinated, a process that results in APC/C reactivation when the SAC is silenced.


Conflict of interest statement

The authors declare no competing financial interests.

Figures

Extended Data Figure 1
Extended Data Figure 1. Biochemical characterization of recombinant APC/CMCC complex and preparations of wild type and mutant complexes.
a,b,c,d,e SDS PAGE gels (stained with coomassie) of gel filtration peak fraction from wild type and mutant APC/CMCC complexes preparations used in this study. Western blot against Strep tag in (e) confirms the presence of Apc15ΔNTH-Strep.construct. f, Top: Western blot performed with anti-Apc3 antibody to monitor the time-dependent phosphorylation of this subunit induced by okadaic acid (OA) treatment in the APC/C-expressing insect cells. Bottom: Western blot against was used as a loading control and reflects the decrease in cell viability after addition of OA (data not shown). g, Western blot against His6-tagged ubiquitin of in vitro securin ubiquitination assays performed with either APC/C or APC/COA in either the presence or absence of Cdc20. h, the input sample for the ubiquitination assays performed in this study is shown. i, Western blot against securin of in vitro securin ubiquitination assays performed with APC/COA and Cdc20 with or without either MCC or miniMCC. j, SDS PAGE of APC/CMCC reconstituted with MBP-TEV-Cdc20APC/C and untagged Cdc20MCC. MBP-TEV-Cdc20APC/C TEV cleavage products are indicated. k, SDS PAGE gels of reconstituted APC/CΔApc15-MCC complex. l, Western blot against His6-tagged ubiquitin of in vitro securin ubiquitination assays performed with APC/C ΔApc15 and Cdc20 with or without MCC. m, Western blot against His6-tagged ubiquitin of in vitro Cdc20 ubiquitination assays performed with APC/CMCC and increasing concentrations of UbcH10. Experiments g, l, m were replicated three times and i four times. See Supplementary Fig. 1 for gel source data.
Extended Data Figure 2
Extended Data Figure 2. Stability of APC/CMCC complex, negative staining-EM reconstructions of APC/CMCC wild type and mutant complexes and Cryo-EM analysis.
a, Top: chromatogram showing the elution profile of the APC/CMCC complex run on a Superose 6 column. Apo APC/COA and thyroglobulin standard molecular weight marker (669 kDa) are indicated. Bottom: SDS PAGE of the eluted fractions. APC/CMCC elutes earlier than APC/COA. b, Negative stain-EM reconstructions performed for this study and EMD-1591 (ref. 31) are shown. APC/C (grey) and MCC-Cdc20APC/C module (red) are highlighted. The APC/CMCC and APC/CApc2ΔWHB-MCC reconstructions are also shown in the same orientation as in Figure 4 to facilitate comparisons. c, A typical cryo-EM micrograph of APC/CMCC-Closed representative of 20,234 micrographs. d, Gallery of two-dimensional class averages of APC/CMCC-Closed showing different views representative of 50 two-dimensional classes. e, density quality for secondary structures. The APC/CMCC-Closed map was filtered to 4.0 Å.
Extended Data Figure 3
Extended Data Figure 3. Resolution and other Cryo-EM features of APC/CMCC complexes.
a, Fourier Shell Correlation (FSC) curves, (b, c, d) local resolution maps calculated with RESMAP are shown for all the cryo-EM reconstructions determined in this study, b, ribbon representations of structures shown, c, overall views of local resolution maps, d, close up of platform region (Apc4, Apc5, Apc15). All the maps shown in (c) and (d) are filtered to 8.5 Å. Local resolution colour scheme is indicated in the bar at the bottom of (d). e, the APC/CUbcH10-MCC reconstruction filtered at 12 Å and shown at different threshold levels. The lowest threshold is the same as in Fig. 5b.
Extended Data Figure 4
Extended Data Figure 4. Three-dimensional classification of APC/CMCC.
a, b, 3D class averages obtained by classification with local searches (see Methods) are shown in (a). Classes 1-5 (56%) show density for the MCC-Cdc20APC/C module with classes 1-3 and 4-5 having a closed-like and an open-like conformation respectively (framed in red, see Methods). Particles from classes 1-3 and 4-5 were separately refined and re-classified using a mask (yellow, see Methods) shown in (b) to isolate the best quality particles for APC/CMCC-Closed (mask 1: left) and APC/CMCC-Open (mask 2: right). Percentages for each of the classes relative to the total number of selected particles are indicated. The percentages relative to the total number of APC/CMCC particles are indicated in parenthesis.
Extended Data Figure 5
Extended Data Figure 5. Features of the APC/CMCC structure.
a,b,c, Cryo-EM density and fitted coordinates for Cdc20APC/C_IR (a), Cdc20APC/C_NTD (b), C-Mad2 (c) are shown. Colours for each subunit are as for Fig. 1. d, Overall superposition of the APC/CCdc20-Hsl1 structure (red) with the APC/CMCC-closed structure (green). The Cdc20WD40 change of position is illustrated and the blades forming the D-box (yellow) binding pocket is highlighted. e, Superposition of Apc4, Apc5 and Apc15 between APC/CCdh1-Hsl1-UbcH10-Ub structure (grey) and APC/CMCC (subunit colours as in Fig. 1) shows the dramatic conformational change of Apc4HBD, Apc5NTD and Apc15NTH induced by Cdc20MCC binding to its indicated binding site on Apc4HBD. f, close up view of the Cdc20MCC CRY box recognition site of Cdc20APC/C. The CRY box also contacts BubR1 in proximity to D1. Colours for each subunit are as for Fig. 1. g, Superposition of the Apc2WHB domains from APC/CMCC and APC/CCdh1-Hsl1-UbcH10-Ub structures and the corresponding interacting regions of BubR1TPR and UbcH10 are shown. Bottom left: the residues mutated in BubR1Wm that contact Apc2WHB and used in the ubiquitination assay shown in Fig. 5d are indicated (red). Bottom right: Residues of UbcH10 (red) that contact the corresponding site on Apc2WHB ablate APC/C UbcH10-dependent ubiquitination activity .
Extended Data Figure 6
Extended Data Figure 6. Conservation analysis on BubR1A1-K2 and BubR1TPR regions.
a, Similarities in modes of binding of BubR1 to two Cdc20 subunits of APC/CMCC (left) and Acm1 to two Cdh1 subunits in the Acm1-Cdh1 heterotrimer (right). D box, KEN box, NEN box and ABBA motif are labelled as D, K, NEN and A. BubR1 (colour-ramped from blue to red indicating N to C-terminus) mediates Cdc20 dimer interface, whereas Acm1 mediates a Cdh1 dimer interface. b, Local sequence alignment performed with BubR1A1-K2 region sequences from several species (described on the left as: sequence identifier_protein name_species/residue number) and the S. cerevisiae Acm1A-KEN region. A D-box-like feature (corresponding to Emi1D-box 7-10 positions) precedes the first ABBA motif (A1). A 21-33 residues long linker connects the A1 to the second KEN-box (K2). Conserved positions are highlighted in orange. c, ConSurf analysis of the BubR1TPR region highlighting conserved residues on the Cdc20APC/C binding pocket (i) and on the Apc2WHB domain pocket (ii). The Cdc20APC/C binding pocket is required for a functional SAC . This site interacts with residues of BubR1 immediately N-terminal to KEN-2, thereby reinforcing their contacts with Cdc20APC/C. Residues conservation is indicated in a gradient from cyan to purple. BubR1, Cdc20APC/C and Apc2WHB are coloured as in Fig. 1.
Extended Data Figure 7
Extended Data Figure 7. Three-dimensional classification of APC/C ΔApc15-MCC and APC/C UbcH10-MCC.
a, 3D class averages obtained by classification with local searches (see Methods) are shown for APC/CΔApc15-MCC. Particles from classes 1-3 were refined together for obtaining the final APC/CΔApc15-MCC reconstruction shown in (b). The APC/CΔApc15-MCC map was filtered to 4.8 Å. c, 3D class averages obtained by classification using a mask (yellow, see Methods) are shown for APC/C UbcH10-MCC. Class 1 was used for the final reconstruction. Percentages relative to the total amount of particles are indicated for each of the classes.
Figure 1
Figure 1. Overall structure of the APC/CMCC complex.
a, b. Two views of APC/CMCC. The MCC-Cdc20APC/C module is shown as a cartoon and the APC/C in a surface representation. BubR1 forms extensive contacts with Cdc20APC/C and Apc2. BubR1 inhibitory degrons visible in these views are highlighted.
Figure 2
Figure 2. Interactions of BubR1 with Cdc20APC/C and Cdc20MCC.
a, Schematic of BubR1 and Cdc20. b, Schematic representation of the top views of the Cdc20APC and Cdc20MCC WD40 domains. WD40 domain blades are numbered and the positions of BubR1 inhibitory degrons (orange) are indicated. The CRY degron mediates Cdc20MCC interactions with Cdc20APC/C (Extended Data Fig. 5f). c, Two views showing details of the MCC-Cdc20APC/C module. Cryo-EM density of the BubR1 inhibitory degrons, Cdc20MCC CRY box and KILR motif is shown. Interactions of the BubR1 A1 motif with the Apc10D-box coreceptor and Apc1; BubR1TPR with Apc2WHB; and Cdc20MCC with Apc4HBD are indicated (lower panel). Inset: overall view of APC/CMCC.
Figure 3
Figure 3. Interactions of the MCC-Cdc20APC/C module with the APC/C and APC/C catalytic inhibition by the MCC.
a, Right: an overview of the APC/CMCC model with the corresponding cryo-EM density. Left: segmented cryo-EM density of the Apc8 dimer and its two associated Cdc20 molecules. Cdc20APC/C interacts with Apc8B via its N-terminal domain (NTD). Cdc20MCC interacts with Apc8A through its C-terminal Ile Arg (IR) tail. b, c, d, Comparison of the binding mode of BubR1 and Cdc20MCC_WD40 in APC/CMCC with the binding mode of UbcH10 in APC/CCdh1-UbcH10-Ub (ref. 32). b, Segmented cryo-EM density of Cdc20MCC, BubR1TPR, Apc4HBD and Apc2WHB. (c) APC/CCdh1-UbcH10-Ub. (d) Both structures were superposed. BubR1TPR and Cdc20MCC_WD40 compete for the same binding surfaces on Apc2WHB and Apc4HBD that form the UbcH10 binding site in APC/CCdh1-UbcH10-Ub (Extended Data Fig. 5g). The Apc2WHB sub-domain of Apc2 is shifted in the APC/CMCC complex relative to APC/CCdh1-UbcH10-Ub and would clash with the UbcH10-binding site on Apc11RING.
Figure 4
Figure 4. Cryo-EM structures of APC/CMCC-Open, APC/CΔApc15-MCC, APC/CUbcH10-MCC and comparison with APC/CMCC-Closed.
a, Top: overall view of the cryo-EM density of APC/CMCC-Closed and fitted coordinates for the MCC-Cdc20APC/C module, Apc2WHB and Apc11. The APC/CMCC subunits are coloured as in Figs 1 and 3. b, details of the Apc15NTH-binding site on Apc8A and Apc5. Apc8A and Apc5 are shown. The position of the disordered Apc15NTH is indicated by a box. c, d, APC/CΔApc15-MCC (Apc15 deleted). e, f, APC/CMCC-Open and g, h, the APC/CUbcH10-MCC complex. Shown in (a, b), in APC/CMCC-Closed, BubR1TPR interacts with Apc2WHB, and Apc15NTH is disordered. (c, d) In APC/CΔApc15-MCC the MCC-Cdc20APC/C adopts the closed conformation, blocking the catalytic module. Conversely in APC/CMCC-Open (e, f) and APC/CUbcH10-MCC (g, h), BubR1TPR no longer interacts with Apc2WHB, and Apc15NTH is ordered. (g) In APC/CUbcH10-MCC, Apc2WHB and Apc11RING interact with UbcH10. All cryo-EM reconstructions were filtered to 8.5 Å.
Figure 5
Figure 5. Mechanism of Cdc20 auto-ubiquitination by APC/CUbcH10-MCC.
a, b, Model of a Cdc20MCC ubiquitination complex based on the APC/CUbcH10-MCC cryo-EM reconstruction. The UbcH10-ubiquitin conjugate is modelled in the closed conformation . b, Top: cryo-EM density and model of APC/CUbcH10-MCC. The EM map is filtered to 12 Å and displayed at slightly lower threshold than in Fig. 4g, see Extended Data Fig. 3e, for comparisons. Clear EM density connects Cdc20MCC with UbcH10. Bottom: The Cdc20MCC pre-ubiquitination model. Cdc20MCC residues Lys485 and Lys490, ubiquitinated in logarithmic and checkpoint-arrested cells, respectively , are in close proximity to the UbcH10 catalytic site (red sphere). c, Apc15 is required for Cdc20 ubiquitination by recombinant APC/CMCC. d, BubR1Wm mutations at the Apc2WHB interface (R169A, F175A,V200A, L205) (Extended Data Fig. 5g) stimulates Cdc20 ubiquitination. e, Cdc20 residues Lys485 and Lys490 are ubiquitinated by recombinant APC/CMCC (compare lanes 2,3 and 4,5). Apc15NTH is required for Cdc20 ubiquitination by recombinant APC/CMCC (lanes 8,9). f, cartoon illustrating reciprocal regulation of APC/C and MCC by APC/CMCC. In APC/CMCC-Closed, MCC inhibits substrate (e.g. securin and cyclin B) and UbcH10 recognition. Cyclin A and Nek2A can bypass the SAC. In APC/CMCC-Open, the UbcH10-binding site is exposed. Ube2S elongates Ub-conjugates initiated by UbcH10. Experiments in c-e were replicated three times. See Supplementary Fig. 1 for gel source data.

Comment in

References

    1. Meyer HJ, Rape M. Processive ubiquitin chain formation by the anaphase-promoting complex. Seminars in cell & developmental biology. 2011;22:544–550. - PMC - PubMed
    1. Primorac I, Musacchio A. Panta rhei: the APC/C at steady state. The Journal of cell biology. 2013;201:177–189. - PMC - PubMed
    1. Lara-Gonzalez P, Westhorpe FG, Taylor SS. The spindle assembly checkpoint. Current biology: CB. 2012;22:R966–980. - PubMed
    1. Musacchio A. The Molecular Biology of Spindle Assembly Checkpoint Signaling Dynamics. Current biology : CB. 2015;25:R1002–1018. - PubMed
    1. Hoyt MA, Totis L, Roberts BTS. cerevisiae genes required for cell cycle arrest in response to loss of microtubule function. Cell. 1991;66:507–517. - PubMed

Publication types

MeSH terms