. 2016 Aug 11:6:31464.
doi: 10.1038/srep31464.

Retinal Structures and Visual Cortex Activity are Impaired Prior to Clinical Vision Loss in Glaucoma

Affiliations

Retinal Structures and Visual Cortex Activity are Impaired Prior to Clinical Vision Loss in Glaucoma

Matthew C Murphy et al. Sci Rep. .

Abstract

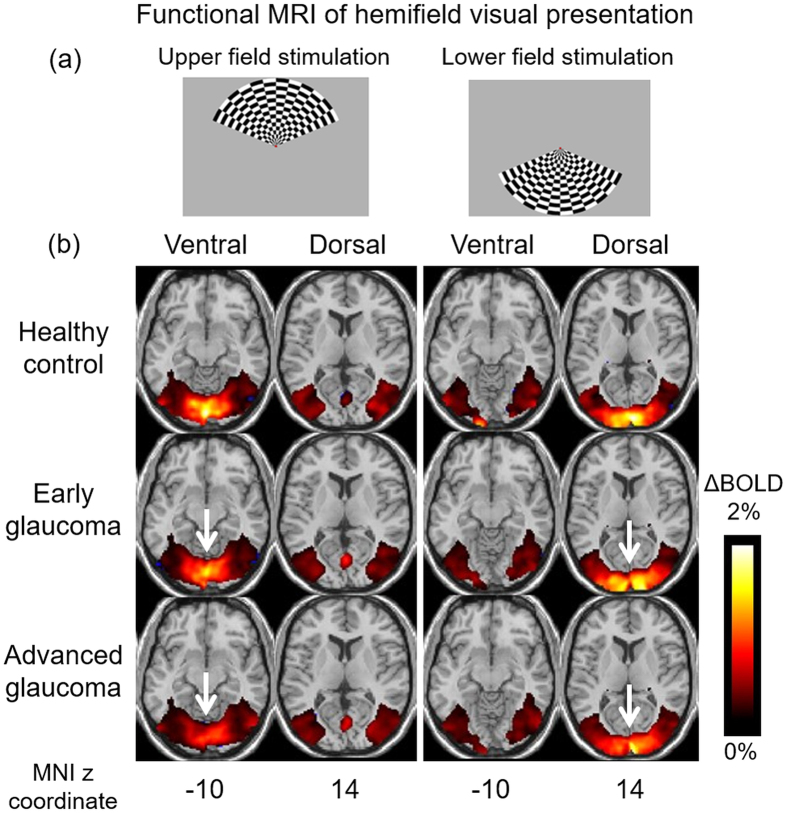
Glaucoma is the second leading cause of blindness worldwide and its pathogenesis remains unclear. In this study, we measured the structure, metabolism and function of the visual system by optical coherence tomography and multi-modal magnetic resonance imaging in healthy subjects and glaucoma patients with different degrees of vision loss. We found that inner retinal layer thinning, optic nerve cupping and reduced visual cortex activity occurred before patients showed visual field impairment. The primary visual cortex also exhibited more severe functional deficits than higher-order visual brain areas in glaucoma. Within the visual cortex, choline metabolism was perturbed along with increasing disease severity in the eye, optic radiation and visual field. In summary, this study showed evidence that glaucoma deterioration is already present in the eye and the brain before substantial vision loss can be detected clinically using current testing methods. In addition, cortical cholinergic abnormalities are involved during trans-neuronal degeneration and can be detected non-invasively in glaucoma. The current results can be of impact for identifying early glaucoma mechanisms, detecting and monitoring pathophysiological events and eye-brain-behavior relationships, and guiding vision preservation strategies in the visual system, which may help reduce the burden of this irreversible but preventable neurodegenerative disease.


Conflict of interest statement

The author(s) have made the following disclosure(s): J.S.S.: Royalties e Zeiss, Dublin, CA (for intellectual property licensed by the Massachusetts Institute of Technology and Massachusetts Eye and Ear Infirmary).

Figures

Figure 1
Figure 1. Functional MRI of visual cortex activity in glaucoma and healthy subjects.
(a) 8 Hz flickering checkerboard patterns were presented to the upper (left column) or lower hemifield (right column) of each subject one eye at a time using the MRI-compatible visual occlusion spectacles (Translucent Technologies, Inc., Toronto, Ontario, Canada) and the e-prime software (Psychology Software Tools, Inc., Sharpsburg, PA, USA). (b) Group-wise mean blood-oxygenation-level-dependent (BOLD) brain activation maps of healthy control (top row, n = 9), early glaucoma (middle row, n = 13) and advanced glaucoma subjects (bottom row, n = 13) (Family-wise error corrected p < 0.01). BOLD percent change (ΔBOLD) represents the amount of brain BOLD activity changes during task periods relative to resting periods. Upper visual field stimulation (first 2 columns) predominantly activated the ventral visual cortex, whereas lower visual field stimulation (last 2 columns) predominantly activated the dorsal visual cortex to a generally stronger extent than upper visual field stimulation due to asymmetry in spatial visual field responses. Note the diminishing brain activity with increasing severity in glaucoma especially in the primary visual cortex (arrows). (MNI: Montreal Neurological Institute).
Figure 2
Figure 2. Relationships between brain activity and eye morphology in glaucoma.
Relationships between visual cortex activity by BOLD functional MRI (y-axis) and (a) peripapillary retinal nerve fiber layer (RNFL) thickness, or (b) macular ganglion cell-inner plexiform layer (GCIPL) thickness measured by optical coherence tomography (OCT) (x-axis). Using linear mixed-effects modeling, superior and inferior RNFL and GCIPL thicknesses were in general most strongly associated with BOLD activity in the corresponding hemifields in primary visual cortex [Brodmann Area (BA) 17], less in secondary visual cortex (BA18), and were not significantly associated in tertiary visual cortex (BA19). BOLD responses also appeared to fit tighter with macular GCIPL than peripapillary RNFL throughout the visual cortex. (*p < 0.05, **p < 0.01, ***p < 0.001: estimated slopes are significantly different from 0 by t test).
Figure 3
Figure 3
Relationships between visual field impairment and (a) eye morphology or (b) visual cortex activity in glaucoma. Retinal structure and visual outcome relationships in glaucoma have been described by a broken-stick (segmented) model, in which detectable visual field functional loss emerges after substantial retinal degeneration in the peripapillary retinal nerve fiber layer (RNFL) reaches a tipping point. Here, we compared Humphrey visual field mean deviation with optical coherence tomography-measured peripapillary RNFL thickness, macular ganglion cell-inner plexiform layer (GCIPL) thickness, and optic nerve head cup-to-disc ratio in (a), and confirmed the existence of a tipping point at 76.9 μm for RNFL [95% confidence interval (C.I.) = 67.9 to 86.0 μm], 59.6 μm for GCIPL (95% C.I. = 54.5 to 64.7 μm) and 0.81 for cup-to-disc ratio (95% C.I. = 0.79 to 0.83) among our glaucoma and healthy subjects. Our data in (b) also demonstrated a broken-stick model relationship between visual field function and blood-oxygenation-level-dependent (BOLD) brain activity in the primary visual cortex [Brodmann Area (BA) 17] at a tipping point of BOLD = 0.58% for upper visual field stimulation (95% C.I. = 0.34 to 0.82%) and BOLD = 0.61% for lower visual field stimulation (95% C.I. = 0.30 to 0.92%), indicating substantial reduction in brain activity before detectable visual field functional loss. The loss from healthy group at the tipping point in the brackets was calculated from the percentage difference between the estimated tipping point and the average value of the healthy group. Red line represents the spline fit, and the black line represents the broken fit model. (*p < 0.05, **p < 0.01, ***p < 0.001: Davies’ test for statistically significant difference in slope between segments).
Figure 4
Figure 4. Brain metabolism and brain microstructures in glaucoma.
(a) Sample proton MR spectrum (white curve) and fitted spectrum (red curve) of the metabolic profiles in the primary visual cortex of a glaucoma patient (left) and a healthy subject (right). Each proton MR spectrum was acquired using a 20 × 25 × 30 mm3 voxel centered at the calcarine sulcus bilaterally as shown in the anatomical images in 3 orthogonal planes (white boxes in insets) to cover both upper and lower visual field representations in both hemispheres. The levels of choline (Cho), N-acetyl-aspartate (NAA), glutamate-glutamine complex (Glx) and creatine (Cr) brain metabolite contents were estimated from the spectrum and normalized to the Cr level for quantitative comparisons. (b) Sample fractional anisotropy maps of a glaucoma patient (left) and a healthy subject (middle) at the level of the optic radiation, and group comparisons of white matter integrity in the brains of glaucoma patients using tract-based spatial statistics (TBSS) of fractional anisotropy maps (right) in diffusion tensor MRI. Green pixels represent the fractional anisotropy skeletons of major tracts overlaid on the anatomical T1-weighted brain images in grayscale. Blue pixels indicate white matter tract regions that showed significantly lower fractional anisotropy in advanced glaucoma compared to early glaucoma patients (threshold-free cluster enhancement corrected, p < 0.05). The optic radiation (yellow arrows) of advanced glaucoma patients showed significantly lower fractional anisotropy than early glaucoma patients in both hemispheres, indicative of trans-neuronal degeneration of brain microstructures. The white matter in the frontal lobe (red arrows) also exhibited lower fractional anisotropy in more advanced glaucoma patients, supportive of a recent hypothesis of widespread structural brain changes beyond the visual system in glaucoma. No apparent difference in fractional anisotropy was observed between early glaucoma and healthy subjects (data not shown).
Figure 5
Figure 5. Relationships between brain metabolism and eye and brain structures in glaucoma.
Relationships between visual cortex metabolism by proton MR spectroscopy (y-axis) and eye (first 3 columns) and brain structures (last column) by optical coherence tomography (OCT) and diffusion tensor MRI, respectively (x-axis). Positive correlations were found when comparing choline level (using Cho:Cr) with peripapillary retinal nerve fiber layer (RNFL) thickness, macular ganglion cell-inner plexiform layer (GCIPL) thickness and fractional anisotropy in optic radiation, whereas negative correlation was observed when comparing Cho:Cr with optic nerve head cup-to-disc ratio. No apparent correlation was found when comparing N-acetyl-aspartate (using NAA:Cr) or glutamate-glutamine complex (using Glx:Cr) level with OCT or diffusion tensor MRI parameters. Note that OCT measurements were averaged between both eyes and then compared with the proton MR spectroscopy data. (*p < 0.05: estimated slopes are statistically significantly different from 0 by t test) (Cr: creatine).
Figure 6
Figure 6. Relationships between Humphrey visual field mean deviation (y-axis) and visual cortex metabolism by proton MR spectroscopy (x-axis).
Positive correlations were found when comparing mean deviation with choline and N-acetyl-aspartate levels (using Cho:Cr and NAA:Cr ratios), whereas a negative trend was observed when testing for correlation between mean deviation with glutamate-glutamine complex level (using Glx:Cr ratio). Note that visual field measurements were averaged between both eyes and then compared with the proton MR spectroscopy data. (*p < 0.05: estimated slopes are statistically significantly different from 0 by t test) (Cr: creatine).

References

    1. Quigley H. A. & Broman A. T. The number of people with glaucoma worldwide in 2010 and 2020. The British journal of ophthalmology 90, 262–267 (2006). - PMC - PubMed
    1. Friedman D. S. et al. Prevalence of open-angle glaucoma among adults in the United States. Arch Ophthalmol 122, 532–538 (2004). - PMC - PubMed
    1. Susanna R. Jr., De Moraes C. G., Cioffi G. A. & Ritch R. Why Do People (Still) Go Blind from Glaucoma? Translational vision science & technology 4, 1 (2015). - PMC - PubMed
    1. Bramley T., Peeples P., Walt J. G., Juhasz M. & Hansen J. E. Impact of vision loss on costs and outcomes in medicare beneficiaries with glaucoma. Arch Ophthalmol 126, 849–856 (2008). - PubMed
    1. Gupta N. & Yucel Y. H. Brain changes in glaucoma. Eur J Ophthalmol 13 Suppl 3, S32–S35 (2003). - PubMed

Publication types