Review
. 2016 Sep;8(5):418-28.
doi: 10.1177/1941738116663922. Epub 2016 Aug 10.

Advanced Imaging in Osteoarthritis

Affiliations
Review

Advanced Imaging in Osteoarthritis

Qi Li et al. Sports Health. 2016 Sep.

Abstract

Context: Radiography is widely accepted as the gold standard for diagnosing osteoarthritis (OA), but it has limitations when assessing early stage OA and monitoring progression. While there are improvements in the treatment of OA, the challenge is early recognition.

Evidence acquisition: MEDLINE and PubMed as well as professional orthopaedic and imaging websites were reviewed from 2006 to 2016.

Study design: Clinical review.

Level of evidence: Level 4.

Results: Magnetic resonance imaging (MRI) can provide the most comprehensive assessment of joint injury and OA with the advantages of being noninvasive and multiplanar with excellent soft tissue contrast. However, MRI is expensive, time consuming, and not widely used for monitoring OA clinically. Computed tomography (CT) and CT arthrography (CTA) can also be used to evaluate OA, but these are also invasive and require radiation exposure. Ultrasound is particularly useful for evaluation of synovitis but not for progression of OA.

Conclusion: MRI, CT, and CTA are available for the diagnosis and monitoring of OA. Improvement in techniques and decrease in cost can allow some of these modalities to be effective methods of detecting early OA.

Keywords: CT; MRI; cartilage; osteoarthritis; ultrasound.


Conflict of interest statement

The author(s) reported no potential conflicts of interest in the development and publication of this manuscript.

Figures

Figure 1.
Figure 1.
T1ρ and T2 maps of (a) a healthy control, (b) a subject with mild osteoarthritis (OA), and (c) a subject with severe OA. Significant elevation of T1ρ and T2 values were observed in subjects with OA. T1ρ and T2 elevation had different spatial distribution and may provide complementary information associated with cartilage degeneration. Reprinted with permission from Li and Majumdar.
Figure 2.
Figure 2.
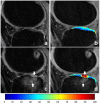
Magnetic resonance images showing the posterior horn of the lateral meniscus in an anterior cruciate ligament (ACL)–injured knee with modified meniscal Whole Organ Magnetic Resonance Imaging Score (WORMS) grade of 0 (a, b, c) and an ACL-injured knee with modified meniscal WORMS grade of 1 (d, e, f). The CUBE (a and d), T1ρ (b and e), and T2 (c and f) images illustrate the discrepancies between subjects with modified meniscal WORMS grades of 0 and 1. The color bar indicates the relaxation measure gradient. Reprinted with permission from Wang et al.
Figure 3.
Figure 3.
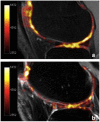
Sodium maps of articular cartilage in (a) a healthy volunteer and (b) a patient with osteoarthritis (OA) overlaid onto proton images. The increased sodium signal in Figure 3a correlates with higher glycosaminoglycan (GAG) concentration. As cartilage degenerates and GAG concentration decreases, sodium signal declines (b). Reprinted with permission from Braun and Gold.
Figure 4.
Figure 4.
(a and c) Double-echo steady state (DESS) and (b and d) corresponding T1Gd reformat for separate analysis of acetabular and femoral cartilage. Reprinted with permission from Zilkens et al.
Figure 5.
Figure 5.
A 36-year-old man with a full-thickness focal cartilage defect of the lateral weightbearing femoral condyle treated with the microfracture technique. (a) Sagittal fat-suppressed intermediate-weighted magnetic resonance (MR) image (repetition time/echo time, 3370/34 ms) of the knee 6 weeks after microfracture shows heterogeneous hyperintense repair tissue that does not completely fill the defect (arrow). Note the surgically induced irregularity of the subchondral plate and intense subchondral edema-like marrow signal intensity (arrowheads). (b) MR image obtained 12 weeks after surgery shows near-complete filling of the cartilage defect with repair tissue that is similar in signal intensity to that of the adjacent native cartilage (arrow). There is also a substantive decrease in subchondral edema-like marrow signal intensity (arrowheads). Reprinted with permission from Guermazi et al.
Figure 6.
Figure 6.
A 49-year-old man with a cartilage defect and tear of the anterior cruciate ligament who underwent matrix-associated autologous chondrocyte transplantation. (a) Sagittal proton density–weighted magnetic resonance (MR) image of the knee obtained 24 months after surgery (repetition time/echo time, 2130/36 ms; flip angle, 180°) shows good fill of the defect (arrows) but focal degeneration of the repair with cartilage irregularity at the posterior aspect of the repair. (b) Sagittal sodium (repetition time/echo time, 17/7.7 ms; flip angle, 30°) and (c) glycosaminoglycan chemical exchange saturation transfer (repetition time/echo time, 7.3/3.2 ms; flip angle, 5°) MR images show lower signal intensity within the repair site (arrow) compared with normal reference tissue. Color bars in (b) and (c) represent sodium signal-to-noise ratio and magnetization transfer resonance asymmetry values summed over offsets from 0 to 1.3 ppm, respectively. Reprinted with permission from Guermazi et al.
Figure 7.
Figure 7.
T1ρ color-coded maps of a knee with an anterior cruciate ligament tear at (b) baseline and (d) 2-year follow-up and sagittal fat-suppressed T2-weighted FSE image also obtained for each time point (a, baseline; c, 2-year follow-up). Cartilage injury (downward-facing arrows) within the cartilage overlying the bone marrow lesions (upward-facing arrows) at the lateral tibial plateau is demonstrated in 2-year follow-up images.
Figure 8.
Figure 8.
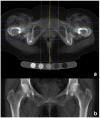
Digitally reconstructed radiography (DRR) process from helically acquired computed tomography (CT) data using OsiriX. (a) Axial mean intensity projection reformat of the original data showing the sagittal (orange) plane used to align along the anteroposterior axis of the pubic symphysis and the coronal (cyan) reformat plane with outer lines marking the limits of the reconstructed slab just beyond the anterior and posterior hip joint margins. (b) Coronal mean intensity projection slab (usually 6-8 cm in depth) showing the DRR used for minimum joint space width measurement and KL grading (window level, 200; window width, 700; magnification up to 200%). Reprinted with permission from Turmezei et al.

References

    1. Akella SV, Regatte RR, Gougoutas AJ, et al. Proteoglycan-induced changes in T1ρ-relaxation of articular cartilage at 4T. Magn Reson Med. 2001;46:419-423. - PubMed
    1. Allen BC, Peters CL, Brown NA, Anderson AE. Acetabular cartilage thickness: accuracy of three-dimensional reconstructions from multidetector CT arthrograms in a cadaver study. Radiology. 2010;255:544-552. - PMC - PubMed
    1. Amano K, Pedoia V, Su F, Souza RB, Li X, Ma CB. Persistent biomechanical alterations after acl reconstruction are associated with early cartilage matrix changes detected by quantitative MR. Orthop J Sports Med. 2016;4:2325967116644421. - PMC - PubMed
    1. Anandacoomarasamy A, Leibman S, Smith G, et al. Weight loss in obese people has structure-modifying effects on medial but not on lateral knee articular cartilage. Ann Rheum Dis. 2012;71:26-32. - PubMed
    1. Apprich S, Trattnig S, Welsch GH, et al. Assessment of articular cartilage repair tissue after matrix-associated autologous chondrocyte transplantation or the microfracture technique in the ankle joint using diffusion-weighted imaging at 3 Tesla. Osteoarthritis Cartilage. 2012;20:703-711. - PubMed