

Projected increase in amyotrophic lateral sclerosis from 2015 to 2040
- PMID: 27510634
- PMCID: PMC4987527
- DOI: 10.1038/ncomms12408
Projected increase in amyotrophic lateral sclerosis from 2015 to 2040
Abstract
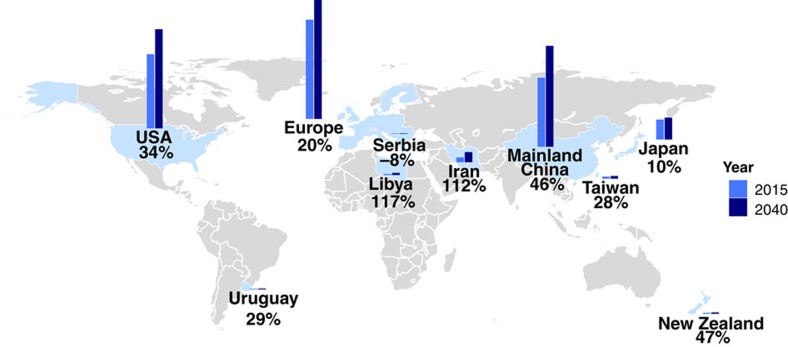
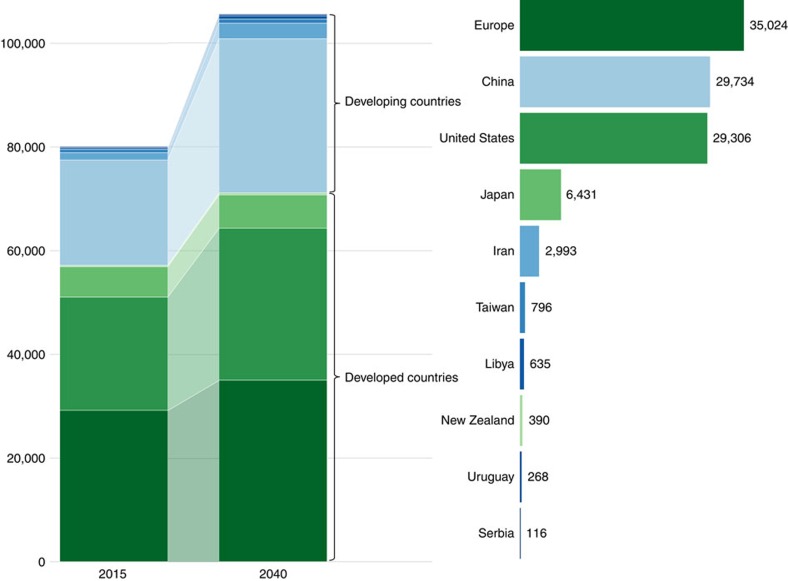
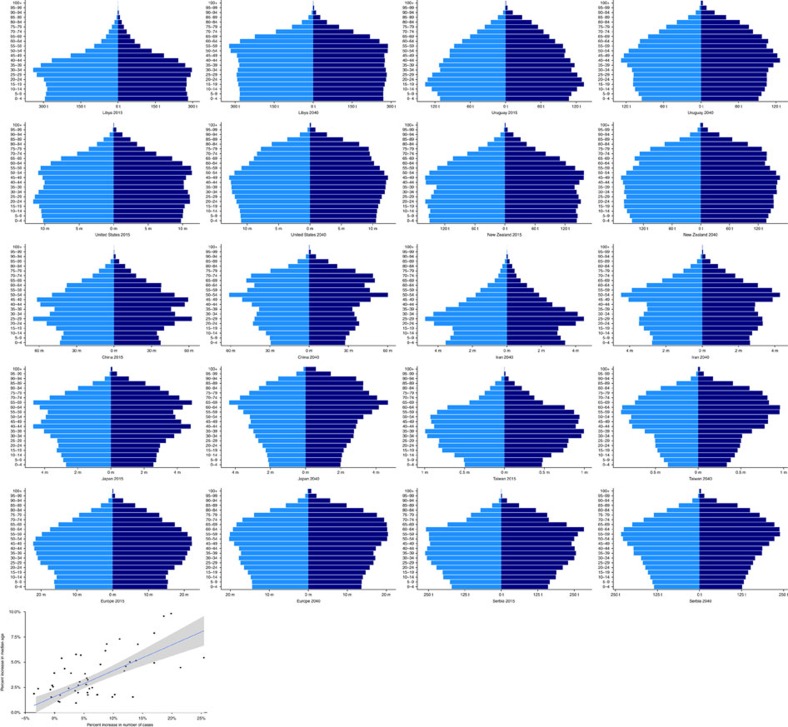
Although amyotrophic lateral sclerosis (ALS) is relatively rare, the socioeconomic significance of the disease is extensive. It is therefore vital to project the epidemiologic trend of ALS. To date, there have been few published studies attempting to estimate the number and distribution of ALS cases in the upcoming years. Here we show that the number of ALS cases across the globe will increase from 222,801 in 2015 to 376,674 in 2040, representing an increase of 69%. This increase is predominantly due to ageing of the population, particularly among developing nations. This projection is likely an underestimate due to improving healthcare and economic conditions. The results should be used to inform healthcare policy to more efficiently allocate healthcare resources.
Figures
References
-
- United Nations, Department of Economic and Social Affairs, Population Division. World Population Ageing 2013. ST/ESA/SER.A/348, 12 (United Nations publication, 2013).
-
- Sen K. & Bonita R. Global health status: two steps forward, one step back. Lancet 356, 577–582 (2000). - PubMed
-
- Dorsey E. R. et al. Projected number of people with Parkinson disease in the most populous nations, 2005 through 2030. Neurology 68, 384–386 (2007). - PubMed
-
- Wild S., Roglic G., Green A., Sicree R. & King H. Global prevalence of diabetes: estimates for the year 2000 and projections for 2030. Diabetes Care 27, 1047–1053 (2004). - PubMed
Publication types
MeSH terms
Grants and funding
LinkOut - more resources
Full Text Sources
Other Literature Sources
Medical
Miscellaneous
