. 2016 Aug 11:6:31201.
doi: 10.1038/srep31201.

Localized Down-regulation of P-glycoprotein by Focused Ultrasound and Microbubbles induced Blood-Brain Barrier Disruption in Rat Brain

Affiliations

Localized Down-regulation of P-glycoprotein by Focused Ultrasound and Microbubbles induced Blood-Brain Barrier Disruption in Rat Brain

HongSeok Cho et al. Sci Rep. .

Abstract

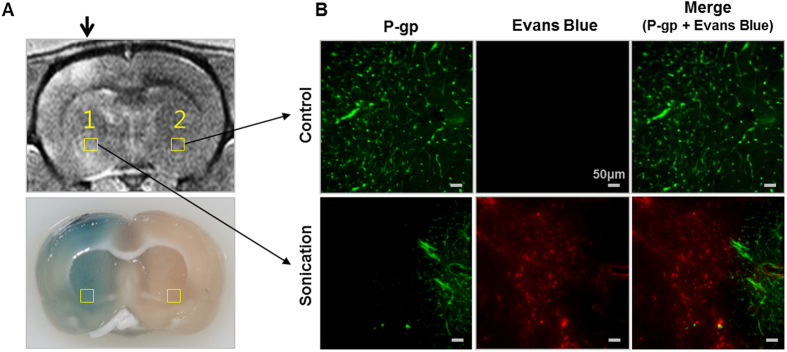
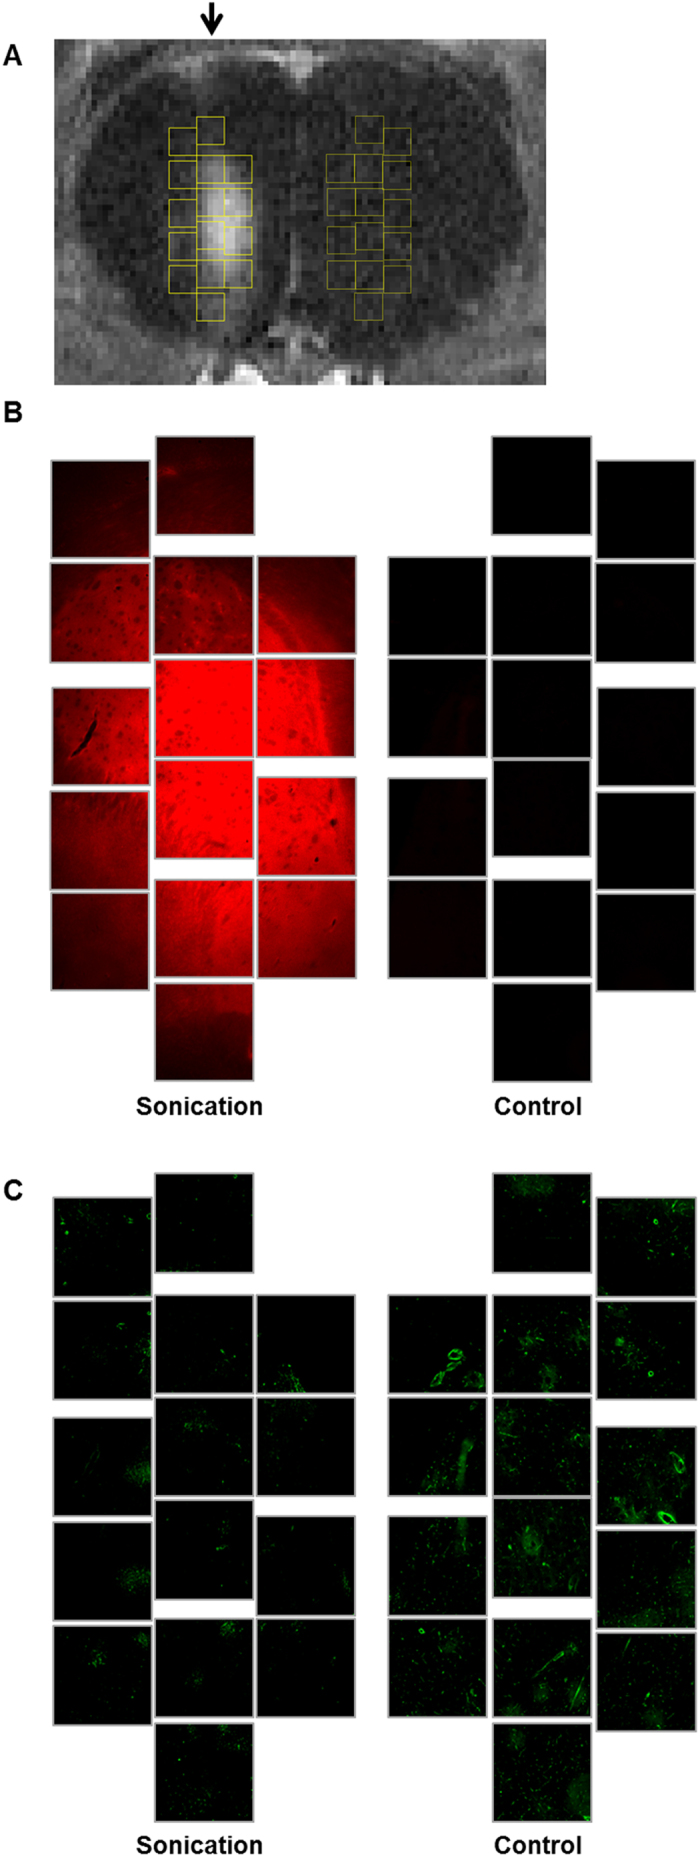
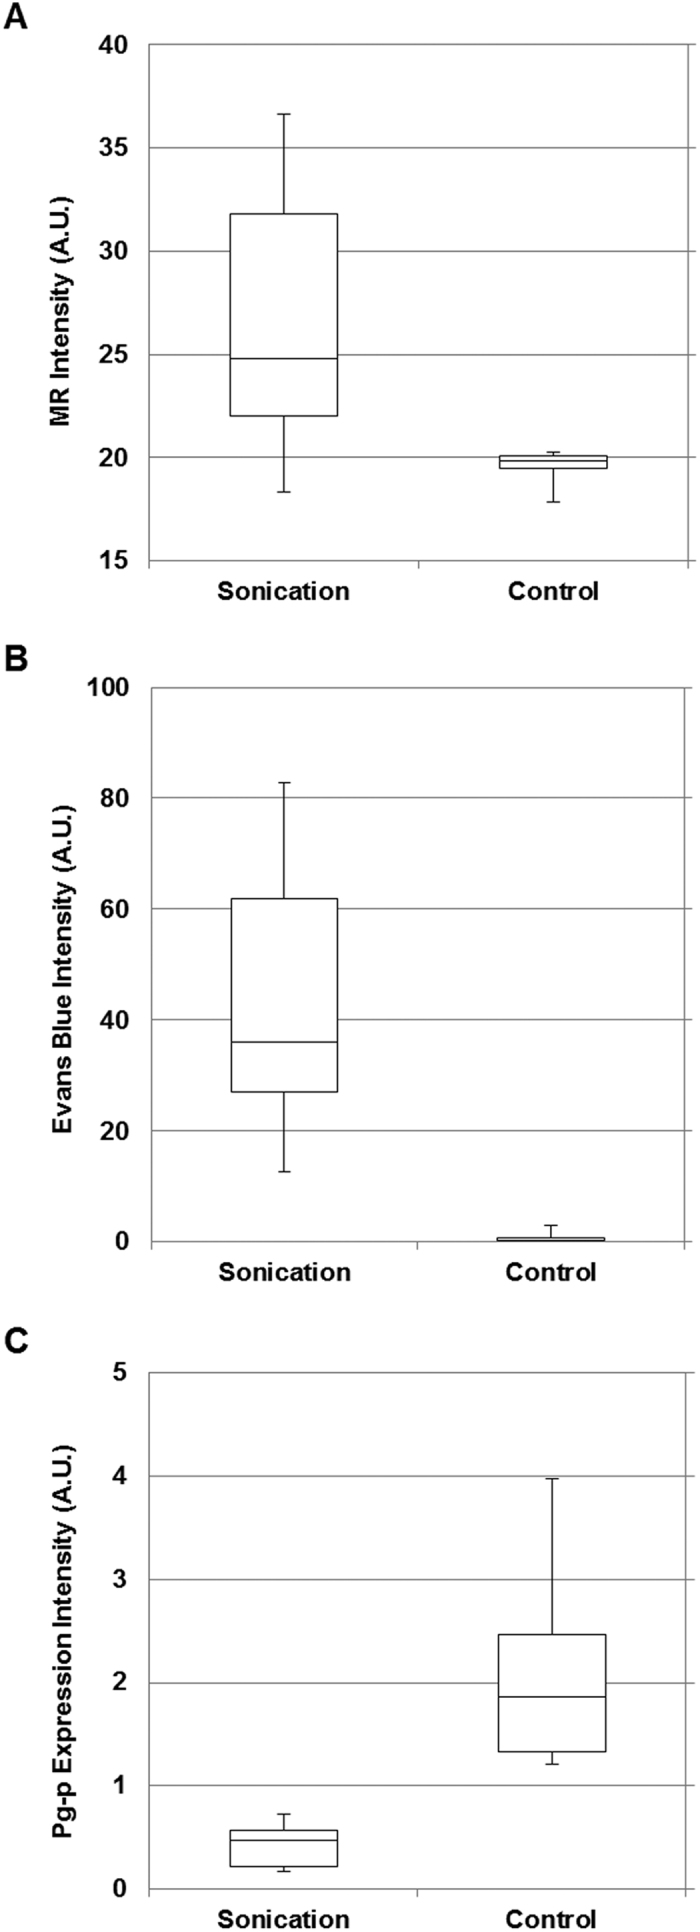
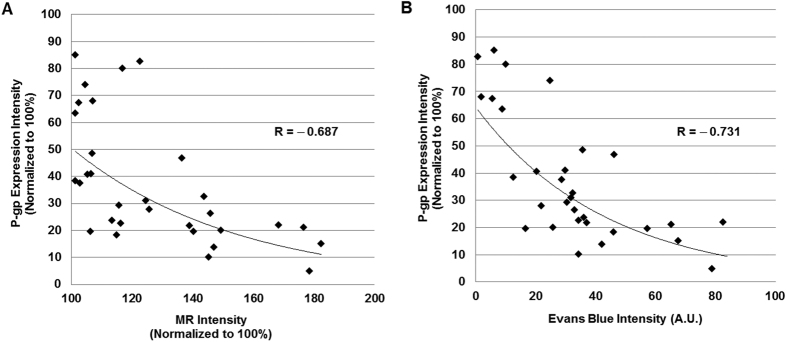
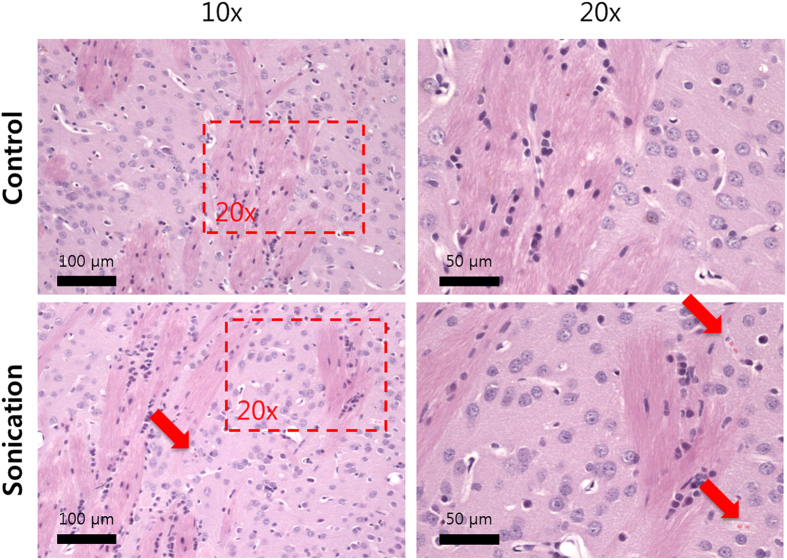
Multi-drug resistant efflux transporters found in Blood-Brain Barrier (BBB) acts as a functional barrier, by pumping out most of the drugs into the blood. Previous studies showed focused ultrasound (FUS) induced microbubble oscillation can disrupt the BBB by loosening the tight junctions in the brain endothelial cells; however, no study was performed to investigate its impact on the functional barrier of the BBB. In this study, the BBB in rat brains were disrupted using the MRI guided FUS and microbubbles. The immunofluorescence study evaluated the expression of the P-glycoprotein (P-gp), the most dominant multi-drug resistant protein found in the BBB. Intensity of the P-gp expression at the BBB disruption (BBBD) regions was significantly reduced (63.2 ± 18.4%) compared to the control area. The magnitude of the BBBD and the level of the P-gp down-regulation were significantly correlated. Both the immunofluorescence and histologic analysis at the BBBD regions revealed no apparent damage in the brain endothelial cells. The results demonstrate that the FUS and microbubbles can induce a localized down-regulation of P-gp expression in rat brain. The study suggests a clinically translation of this method to treat neural diseases through targeted delivery of the wide ranges of brain disorder related drugs.


Figures

Figure 1
Figure 1. Representative data obtained from a rat brain comparing a sonication region and a control region after focused ultrasound and microbubbles treatment.
(A) Top: Contrast-enhanced T1-weighted MR image of a rat brain after sonication. The sonicated direction is indicated by the black arrow. Location 1 and 2 is selected for fluorescence microscopy for P-gp expression and Evans Blue. Bottom: The corresponding tissue slice of the rat brain. The BBB disruption region is indicated by Evans Blue dye. (B) Top: Fluorescence images of the control region showing P-gp expression intensity and Evans Blue intensity, respectively. Bottom: Fluorescence images of the sonicated region.
Figure 2
Figure 2. An MR and fluorescence images of a rat brain after a sonication.
(A) Contrast-enhanced T1-weighted MR image of a rat brain after sonication. The sonicated direction is indicated by the black arrow. Yellow squares indicate 15 selected areas over sonication region and control region for fluorescence analysis of P-gp expression and Evans Blue. (B) Immunofluorescence images of the selected areas at the sonication and control regions. The red fluorescent indicates BBB disruption with Evans Blue penetration. (C) Immunofluorescence images of the selected areas with green fluorescent indicating P-gp expression.
Figure 3
Figure 3. Boxplot comparing sonicated region and control region in a total 31 selected areas from three rats.
(A) The MR contrast intensity at the sonication region was compared to the control region. (B) The Evans Blue fluorescence intensity at the sonication region and the control region were compared. (C) The P-gp expression fluorescence intensity was compared between the sonication and the control region.
Figure 4
Figure 4. Correlation between P-gp expression and BBB opening.
(A) Relationship between MR contrast intensity and P-gp expression (B) Relationship between Evans Blue intensity and P-gp expression: The correlation between the magnitude of BBB disruption and the down-regulation of P-gp expression were significant. (R = −0.687, p < 0.001, n = 31; R = −0.731, p < 0.001, n = 31, respectively).
Figure 5
Figure 5. Histology slices of the sonicated rat brains.
Images of sonication location show normal tissue matrix with some extravasations is visible (Hematoxylin-eosin stain).
Figure 6
Figure 6. Experimental setup for acoustic emission controlled BBB disruption (RK-100, FUS Instruments, Toronto, Canada).
The animal is supine and the head is submerged in water tank. The focal area is targeted with MR image guidance and PC-controlled positioning system. The transducer output is feedback controlled by monitoring acoustic emission received through hydrophone located at the center of the transducer.

References

    1. Pardridge W. M. Blood-brain barrier biology and methodology. Journal of neurovirology 5, 556–569, 10.3109/13550289909021285 (1999). - DOI - PubMed
    1. Sheikov N. et al.. Brain arterioles show more active vesicular transport of blood-borne tracer molecules than capillaries and venules after focused ultrasound-evoked opening of the blood-brain barrier. Ultrasound in medicine & biology 32, 1399–1409, 10.1016/j.ultrasmedbio.2006.05.015 (2006). - DOI - PubMed
    1. Tam S. J. & Watts R. J. Connecting vascular and nervous system development: angiogenesis and the blood-brain barrier. Annual review of neuroscience 33, 379–408, 10.1146/annurev-neuro-060909-152829 (2010). - DOI - PubMed
    1. Hawkins B. T. & Davis T. P. The blood-brain barrier/neurovascular unit in health and disease. Pharmacological reviews 57, 173–185, 10.1124/pr.57.2.4 (2005). - DOI - PubMed
    1. Bobo R. H. et al.. Convection-enhanced delivery of macromolecules in the brain. Proceedings of the National Academy of Sciences of the United States of America 91, 2076–2080 (1994). - PMC - PubMed

Publication types

Substances

LinkOut - more resources