

Distribution of coniferin in freeze-fixed stem of Ginkgo biloba L. by cryo-TOF-SIMS/SEM
- PMID: 27510918
- PMCID: PMC4980676
- DOI: 10.1038/srep31525
Distribution of coniferin in freeze-fixed stem of Ginkgo biloba L. by cryo-TOF-SIMS/SEM
Abstract
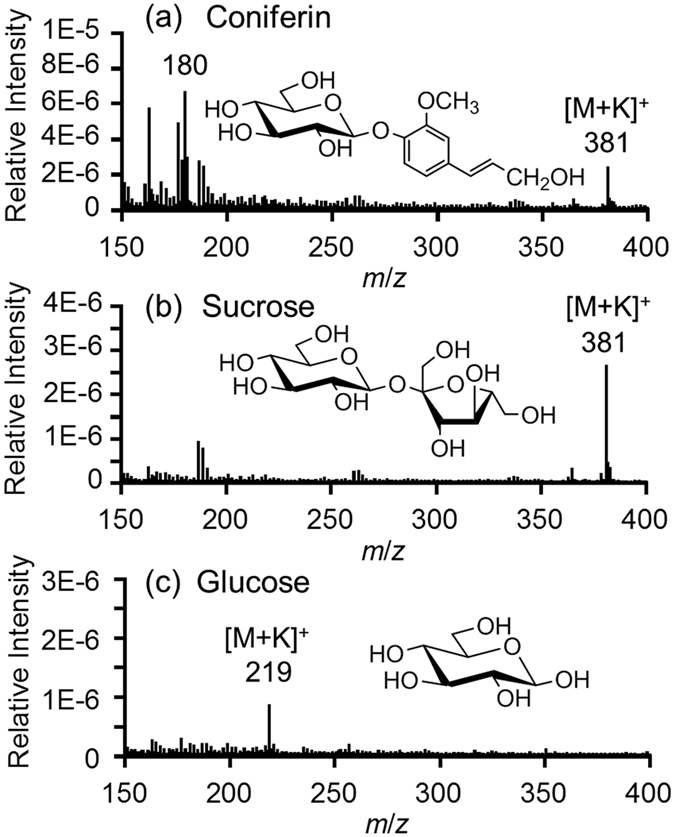
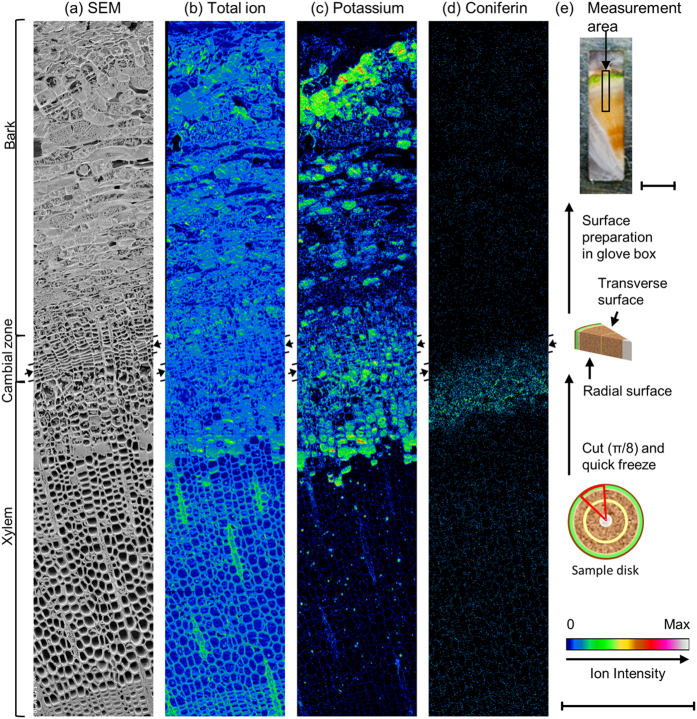
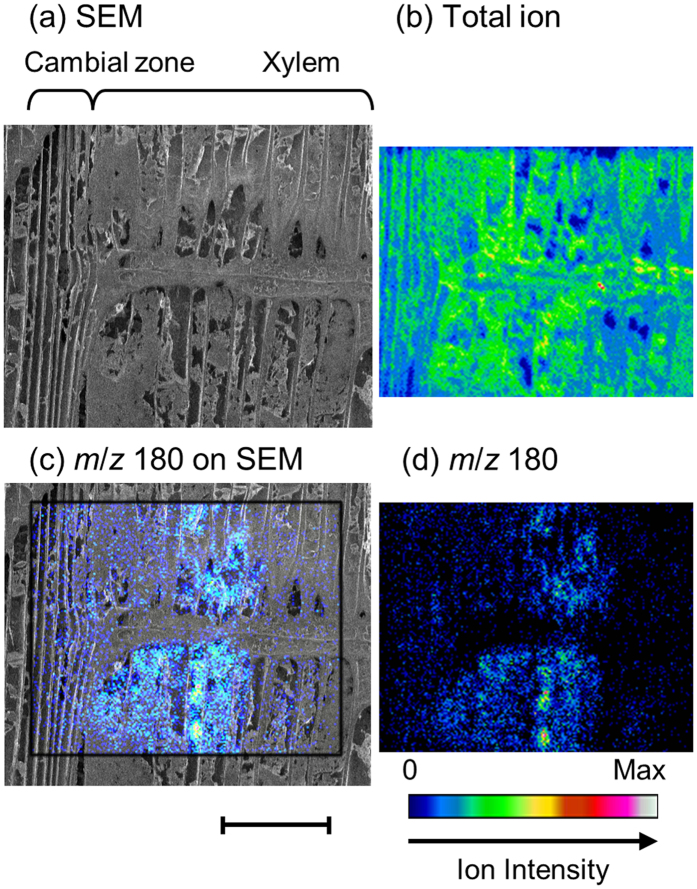
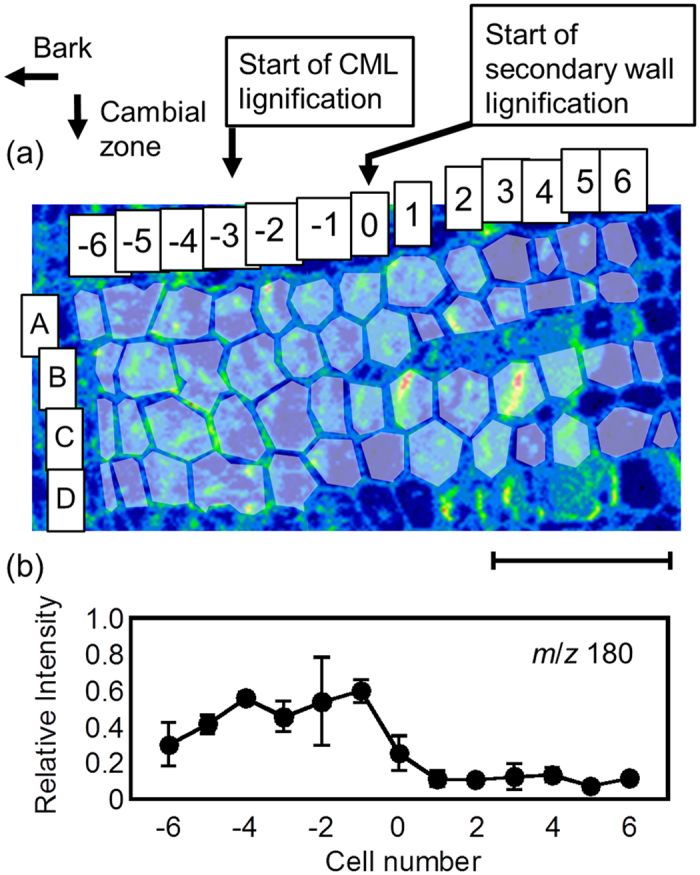
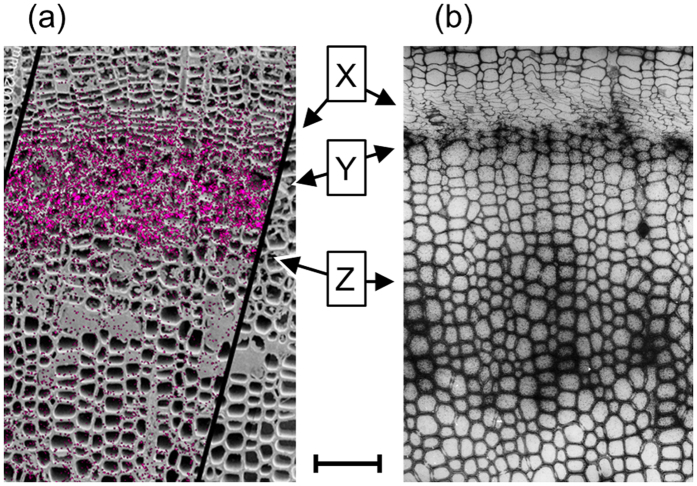
To clarify the role of coniferin in planta, semi-quantitative cellular distribution of coniferin in quick-frozen Ginkgo biloba L. (ginkgo) was visualized by cryo time-of-flight secondary ion mass spectrometry and scanning electron microscopy (cryo-TOF-SIMS/SEM) analysis. The amount and rough distribution of coniferin were confirmed through quantitative chromatography measurement using serial tangential sections of the freeze-fixed ginkgo stem. The lignification stage of the sample was estimated using microscopic observations. Coniferin distribution visualized at the transverse and radial surfaces of freeze-fixed ginkgo stem suggested that coniferin is stored in the vacuoles, and showed good agreement with the assimilation timing of coniferin to lignin in differentiating xylem. Consequently, it is suggested that coniferin is stored in the tracheid cells of differentiating xylem and is a lignin precursor.
Figures

Similar articles
-
Distribution of lignans and lignan mono/diglucosides within Ginkgo biloba L. stem.Phytochemistry. 2022 Apr;196:113102. doi: 10.1016/j.phytochem.2022.113102. Epub 2022 Jan 18. Phytochemistry. 2022. PMID: 35063795
-
Microscopic distribution of syringin in freeze-fixed Syringa vulgaris stems.Plant Direct. 2019 Aug 2;3(8):e00155. doi: 10.1002/pld3.155. eCollection 2019 Aug. Plant Direct. 2019. PMID: 31388649 Free PMC article.
-
Unexpected behavior of coniferin in lignin biosynthesis of Ginkgo biloba L.Planta. 2005 Sep;222(1):58-69. doi: 10.1007/s00425-005-1517-5. Epub 2005 Jun 29. Planta. 2005. PMID: 15986215
-
Phytochemical and medicinal importance of Ginkgo biloba L.Nat Prod Res. 2014;28(10):746-52. doi: 10.1080/14786419.2013.879303. Epub 2014 Feb 5. Nat Prod Res. 2014. PMID: 24499319 Review.
-
Cryo-planing for cryo-scanning electron microscopy.Scanning. 1999 Nov-Dec;21(6):372-8. doi: 10.1002/sca.4950210603. Scanning. 1999. PMID: 10654423 Review.
Cited by
-
Lignin engineering in forest trees: From gene discovery to field trials.Plant Commun. 2022 Nov 14;3(6):100465. doi: 10.1016/j.xplc.2022.100465. Epub 2022 Oct 27. Plant Commun. 2022. PMID: 36307984 Free PMC article. Review.
-
Characterization of the UDP-glycosyltransferase UGT72 Family in Poplar and Identification of Genes Involved in the Glycosylation of Monolignols.Int J Mol Sci. 2020 Jul 16;21(14):5018. doi: 10.3390/ijms21145018. Int J Mol Sci. 2020. PMID: 32708651 Free PMC article.
-
Advanced characterization of biomineralization at plaque layer and inside rice roots amended with iron- and silica-enhanced biochar.Sci Rep. 2021 Jan 8;11(1):159. doi: 10.1038/s41598-020-80377-z. Sci Rep. 2021. PMID: 33420245 Free PMC article.
-
Insight into chemical mechanisms of sepal color development and variation in hydrangea.Proc Jpn Acad Ser B Phys Biol Sci. 2021;97(2):51-68. doi: 10.2183/pjab.97.003. Proc Jpn Acad Ser B Phys Biol Sci. 2021. PMID: 33563878 Free PMC article. Review.
-
Hunting monolignol transporters: membrane proteomics and biochemical transport assays with membrane vesicles of Norway spruce.J Exp Bot. 2020 Oct 22;71(20):6379-6395. doi: 10.1093/jxb/eraa368. J Exp Bot. 2020. PMID: 32777074 Free PMC article.
References
-
- Whetten R. W., MacKay J. J. & Sederoff R. R. Recent advances in understanding lignin biosynthesis. Annu. Rev. Plant Physiol. Plant Mol. Biol. 49, 585–609 (1998). - PubMed
-
- Weng J.-K. & Chapple C. The origin and evolution of lignin biosynthesis. New Phytologist 187, 273–285 (2010). - PubMed
-
- Freudenberg V. K., Reznik H., Fuchs W. & Reichert M. Untersuchung über die Entstehung des Lignins und des Holzes. Die Naturwissenshaften 42, 29–35 (1955).
Publication types
MeSH terms
Substances
LinkOut - more resources
Full Text Sources
Other Literature Sources
