. 2016 Aug 11:7:12420.
doi: 10.1038/ncomms12420.

Autophagy initiation by ULK complex assembly on ER tubulovesicular regions marked by ATG9 vesicles

Affiliations

Autophagy initiation by ULK complex assembly on ER tubulovesicular regions marked by ATG9 vesicles

Eleftherios Karanasios et al. Nat Commun. .

Abstract

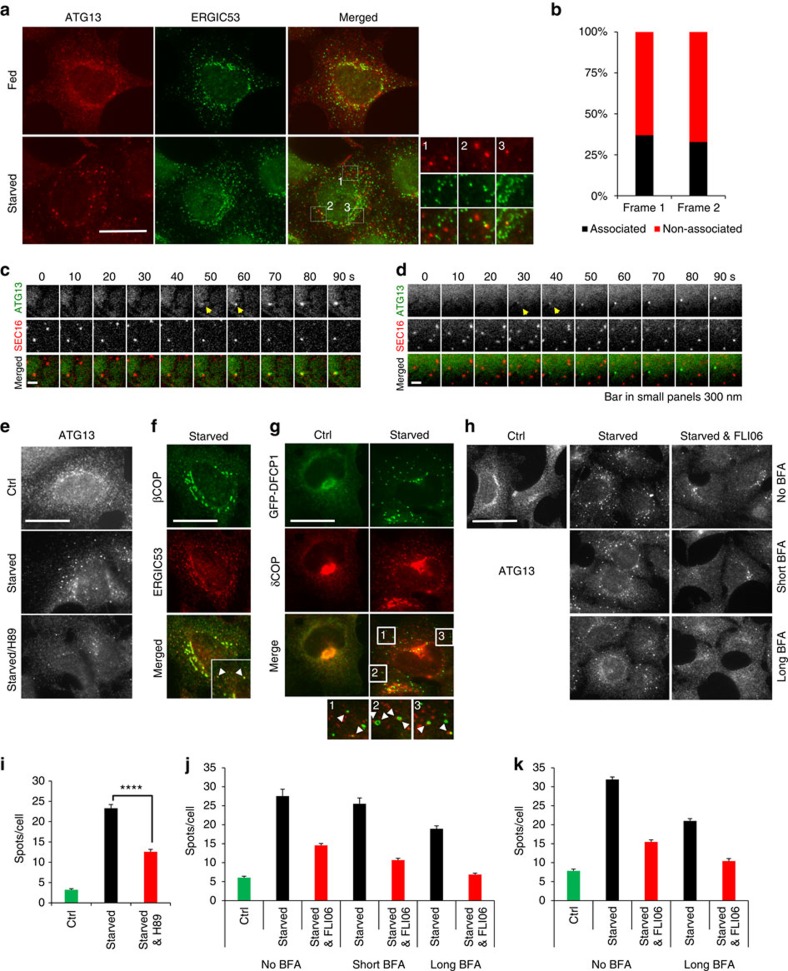
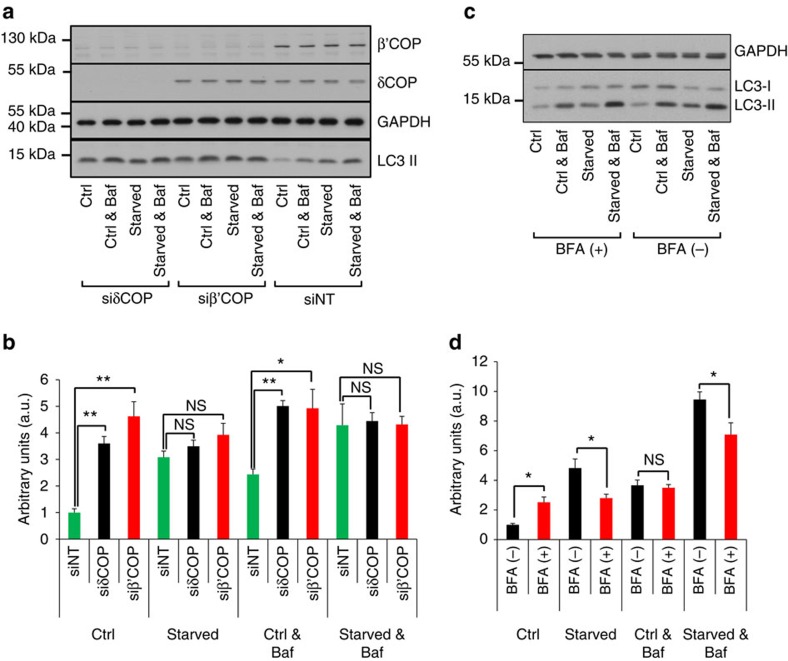
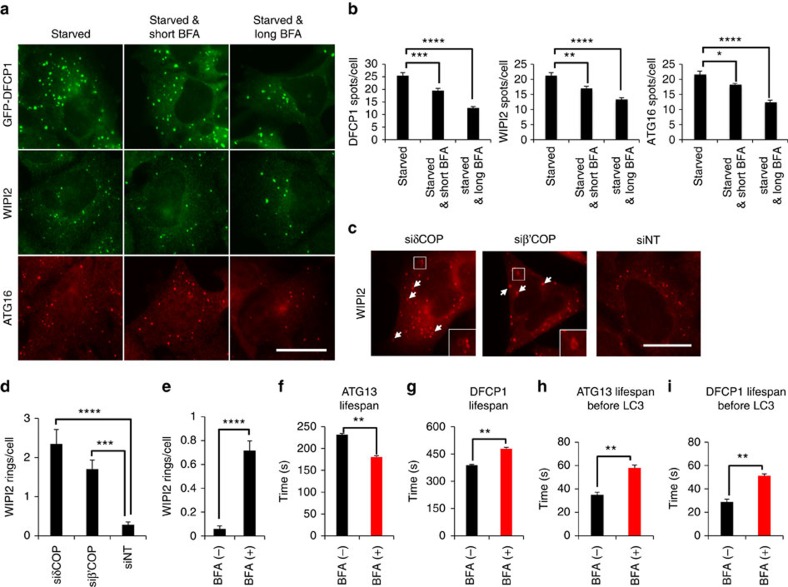
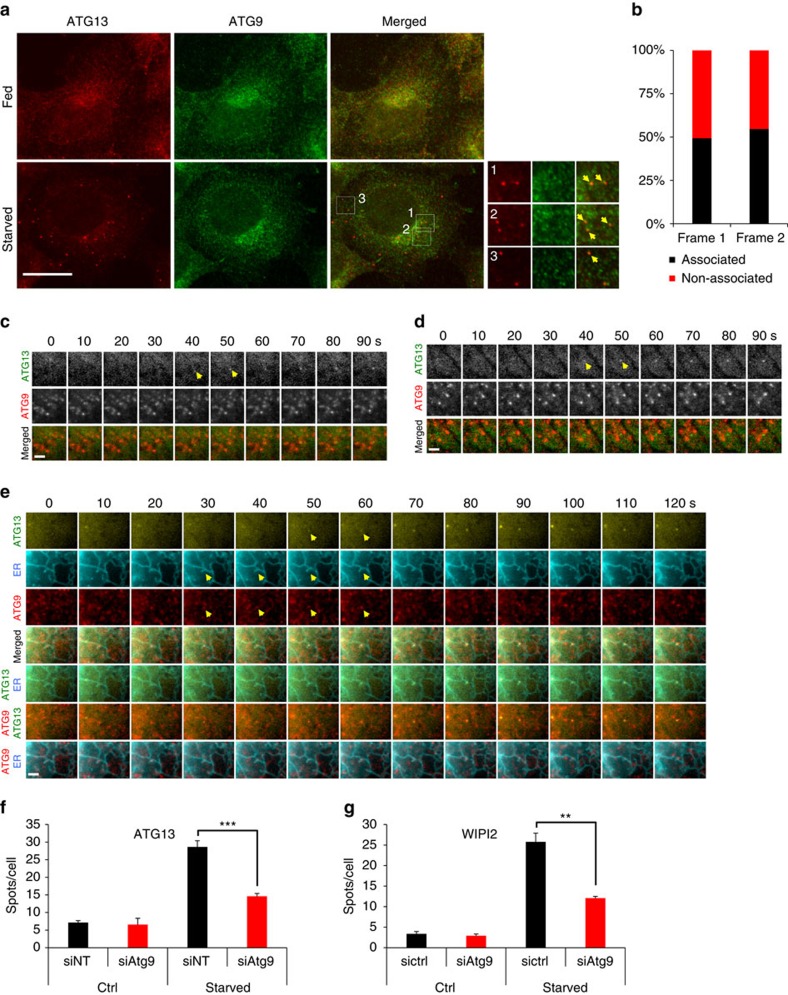
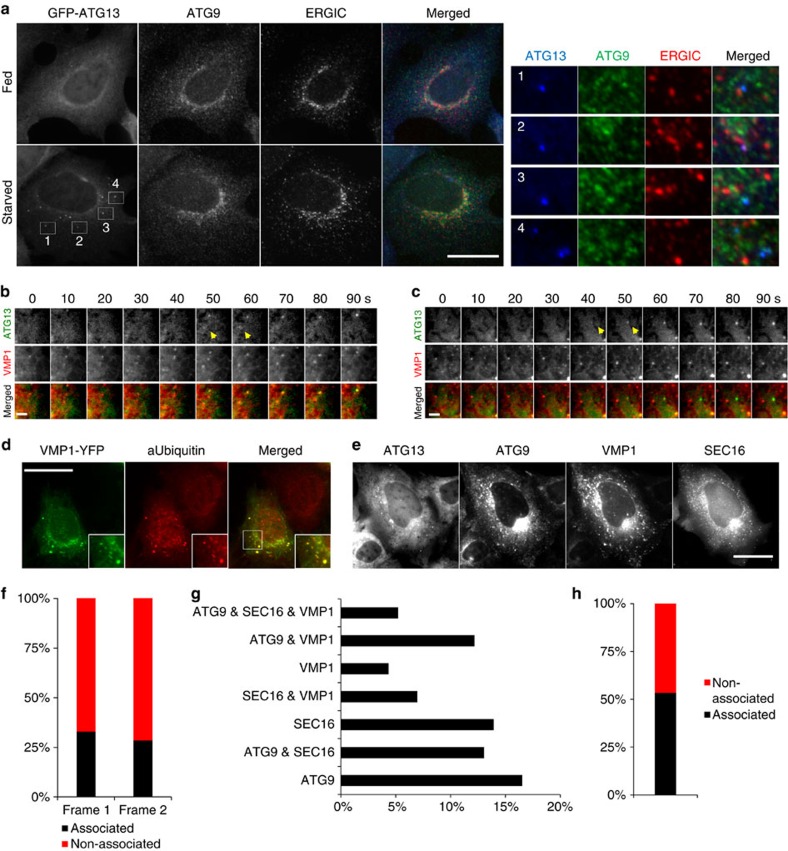
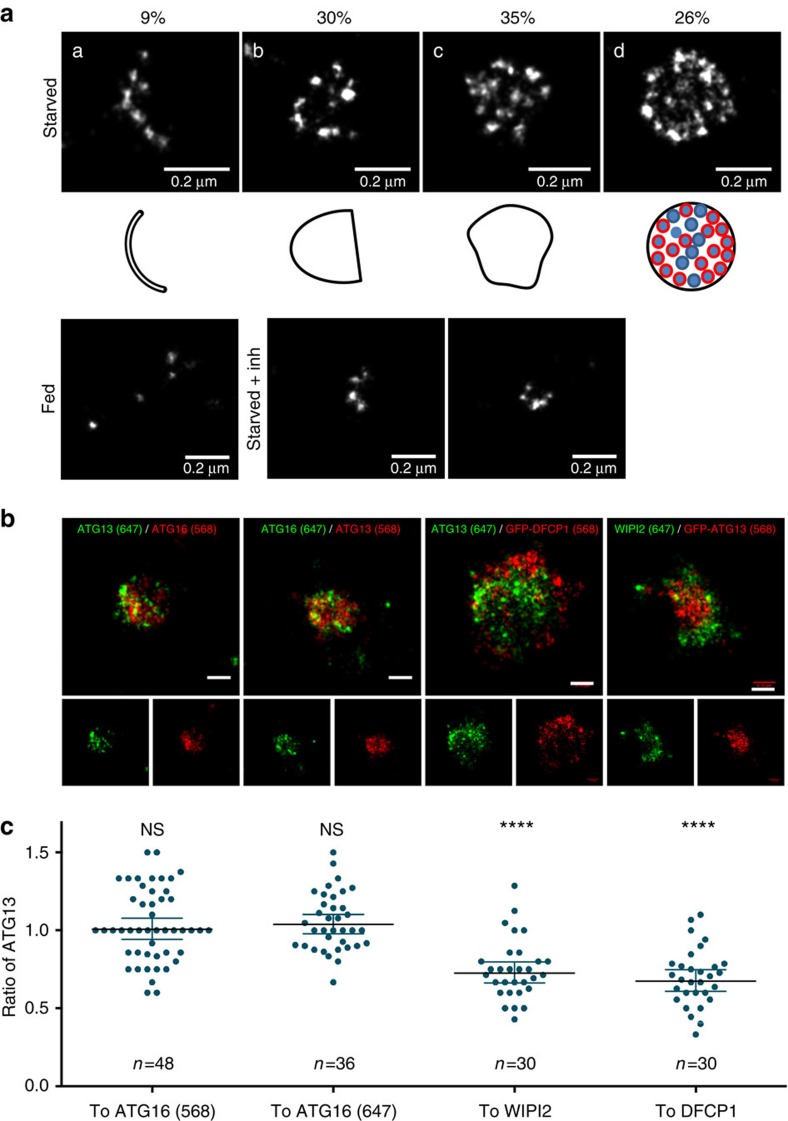
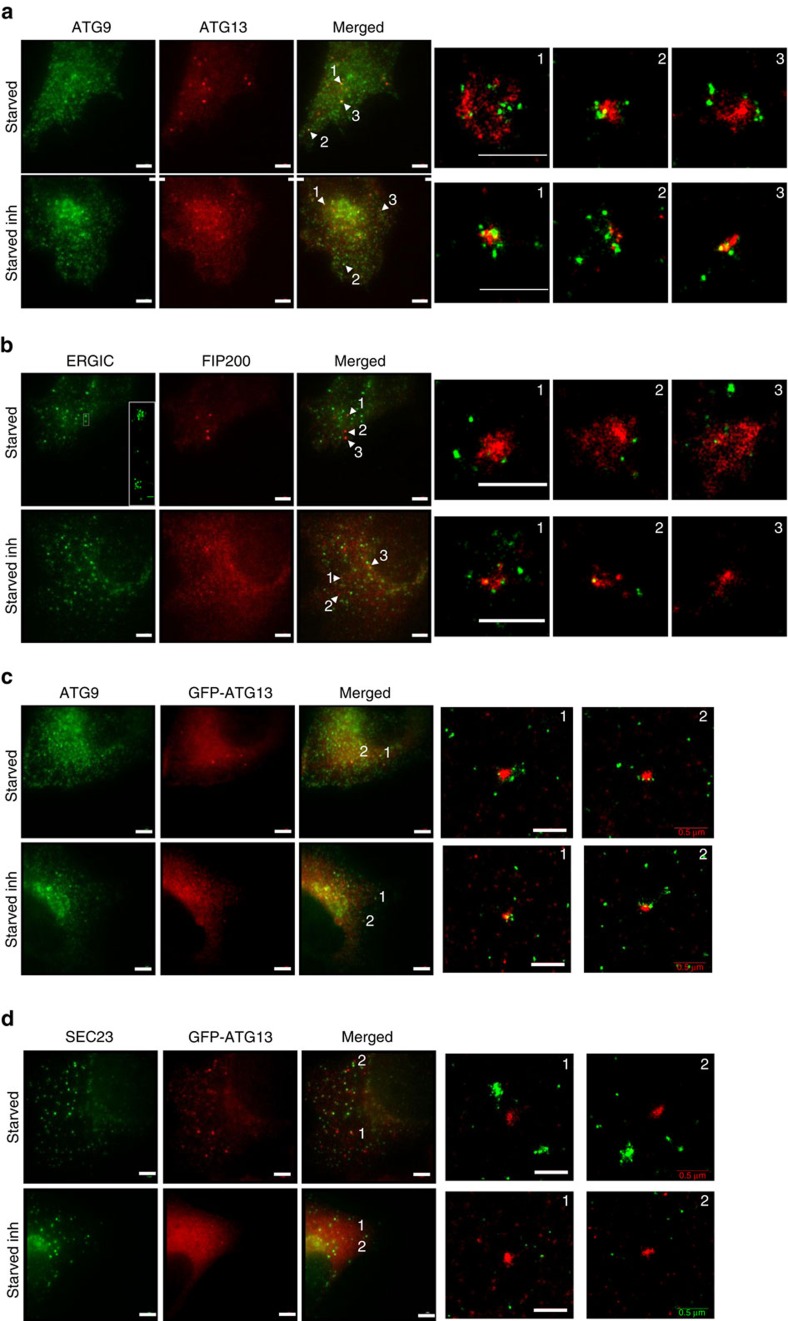
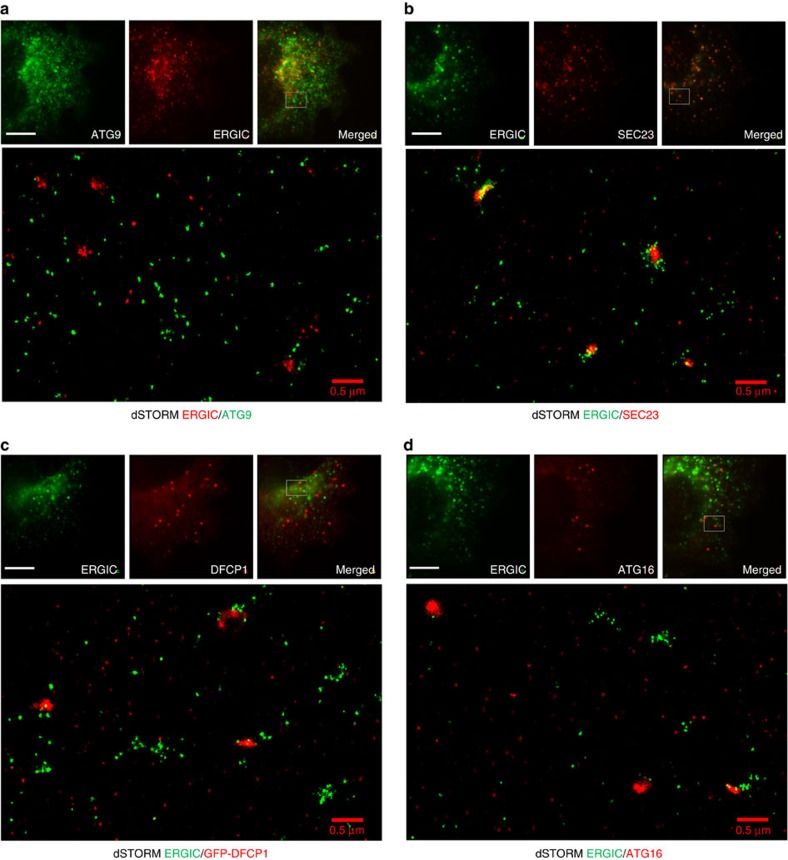
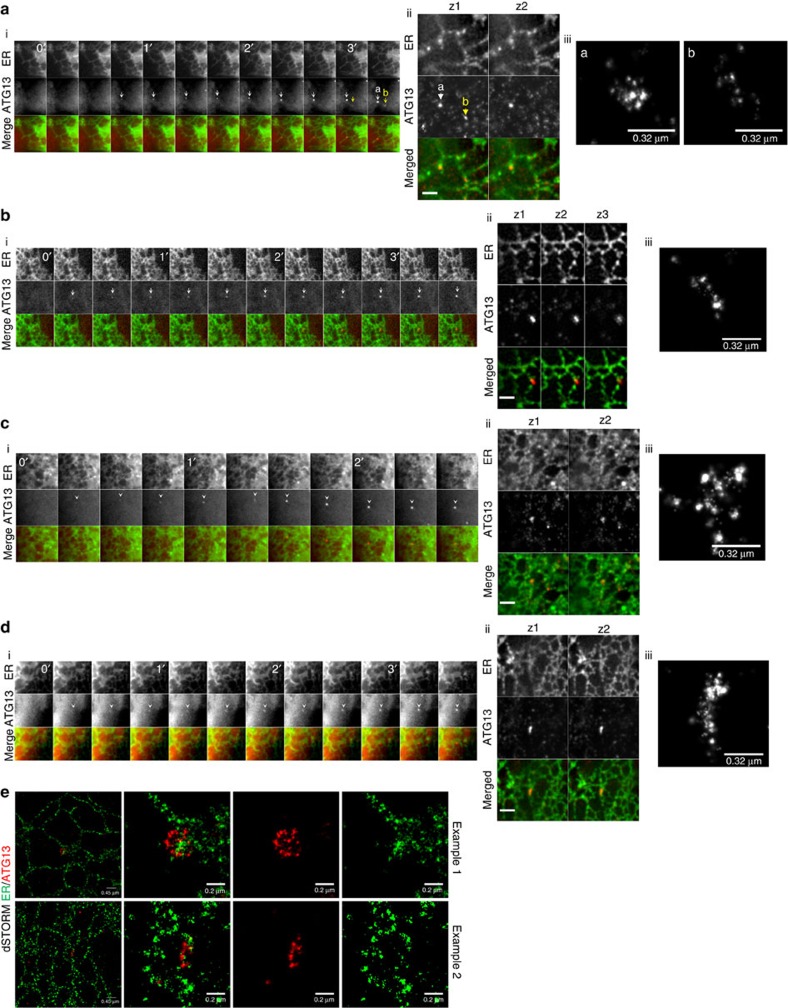
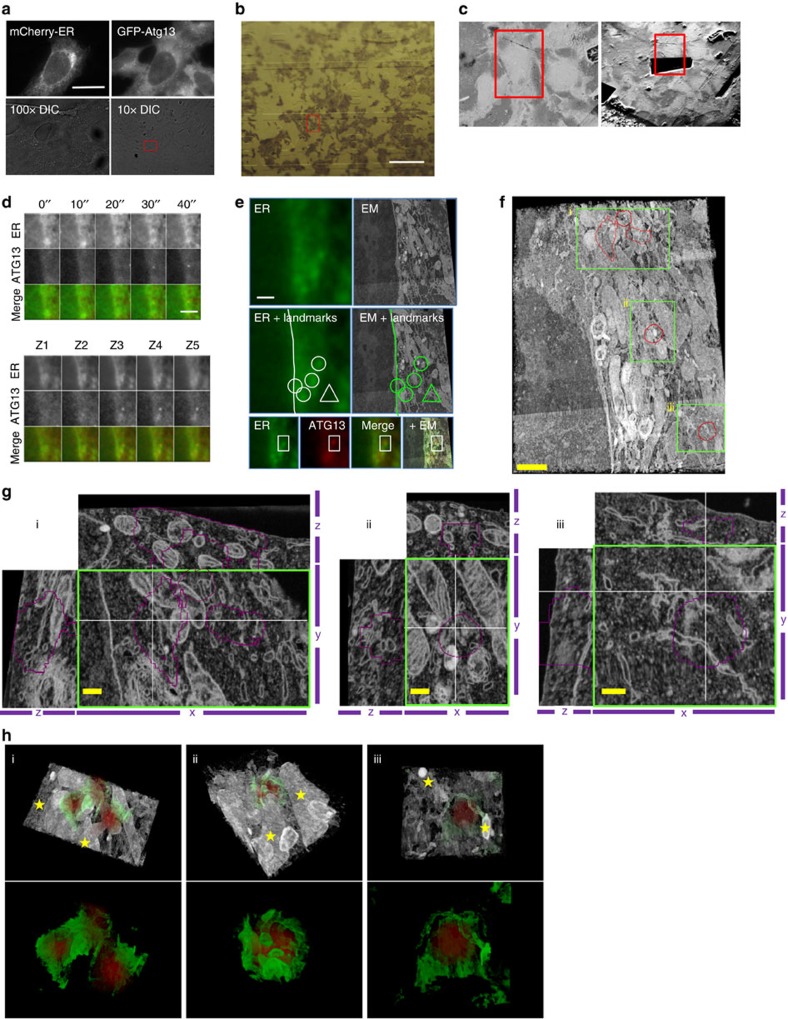
Autophagosome formation requires sequential translocation of autophagy-specific proteins to membranes enriched in PI3P and connected to the ER. Preceding this, the earliest autophagy-specific structure forming de novo is a small punctum of the ULK1 complex. The provenance of this structure and its mode of formation are unknown. We show that the ULK1 structure emerges from regions, where ATG9 vesicles align with the ER and its formation requires ER exit and coatomer function. Super-resolution microscopy reveals that the ULK1 compartment consists of regularly assembled punctate elements that cluster in progressively larger spherical structures and associates uniquely with the early autophagy machinery. Correlative electron microscopy after live imaging shows tubulovesicular membranes present at the locus of this structure. We propose that the nucleation of autophagosomes occurs in regions, where the ULK1 complex coalesces with ER and the ATG9 compartment.


Figures

Figure 1
Figure 1. ER exit promotes the formation of ATG13 puncta.
(a) HEK293 cells were fed or starved for 1 h, immunolabelled for ATG13 and ERGIC53, and imaged by wide-field microscopy. (b) Values are ATG13 particles in c,d associating with SEC16 particles in the first two frames from their emergence. From analysis of 73 montages. (c,d) Wide-field live-cell imaging of starved HEK293 cells expressing stably GFP-ATG13 and transiently mCherry-SEC16. Representative montages of ATG13 particles forming in association with SEC16 (c) or not (d) are shown. Arrowheads point at the ATG13 particles in the first two frames from their emergence, the same that were used for the analysis in b. (e) HEK293 cells were fed or starved for 1 h, treated with 50 μM H89 in the last 30 min, immunolabelled for ATG13 and imaged by wide-field microscopy. (f) HEK293 cells were starved for 1 h, immunolabelled for βCOP and ERGIC53 and imaged by wide-field microscopy. (g) HEK293 cells stably expressing GFP-DFCP1 were fed or starved, immunolabelled for δCOP and imaged by wide-field microscopy. Arrowheads in insets point at COPI particles adjacent to DFCP1 puncta or rings. (h) HEK293 cells were pre-treated with 3 μg ml−1 BFA for 3 h (long BFA) or for 30 min (short BFA) and for 30 min with 100 μM FLI06, then starved for 1 h in the presence or absence of BFA and FLI06, immunolabelled for ATG13 and imaged by confocal laser scanning microscopy. (i) Values are means±s.e.m. puncta of ATG13 per cell in e, for at least five different fields with 15–30 cells each. (j) Values are means±s.e.m. puncta of ATG13 per cell in h, for at least five different fields with 15–30 cells each. (k) Values are means±s.e.m. puncta of ATG13 per cell in an independent experiment, for at least five different fields with 15–30 cells each. Significance levels were determined with unpaired t-tests. ****P=0.0001%. Bar in a,eh corresponds to 10 μm. Bar in ce corresponds to 300 nm.
Figure 2
Figure 2. COPI complex promotes lipidation of LC3.
(a) HEK293 cells were transfected with siRNA targeting δCOP (siδCOP), β'COP (siβ'COP) or non-targeted (siNT), starved in the presence or absence of 0.1 μM bafilomycin and lysed. Lysates were assessed by western blotting using antibodies against LC3, β'COP, δCOP and GAPDH. Note that siRNA depletion of δCOP decreases the stability of β'COP. (b) Western blots from a were quantitated and values of LC3 II normalized to GAPDH and then to the siNT at control conditions are shown as means±s.e.m. From five independent experiments. One arbitrary unit (a.u.) equals the average of LC3 II in fed cells. (c) HEK293 cells were pre-treated for 3 h with 3 μg ml−1 BFA, starved for 1 h in the presence or absence of BFA and bafilomycin and lysed. Lysates were assessed by western blotting using antibodies against LC3 and GAPDH. (d) Western blots from c were quantitated and values of LC3 II normalized to GAPDH and then to the control conditions in the absence of BFA are shown as means±s.e.m. From six independent experiments. One arbitrary unit (a.u.) equals the average of LC3 II in fed cells. Significance levels were determined with repeated-measures analysis of variance followed by Holm–Sidak's multiple comparison tests. NS non significant; *P=0.05%; **P=0.01%.
Figure 3
Figure 3. COPI complex promotes elongation of autophagosomes.
(a) HEK293 cells stably expressing GFP-DFCP1 or the parental cell line were pre-treated for 3 h with 3 μg ml−1 BFA (long BFA), starved for 1 h in the presence of BFA and the parental cell line was immunolabelled for WIPI2 or ATG16. Cells were imaged by wide-field microscopy. Short BFA corresponds to non-pre-treated cells. Bar corresponds to 10 μm. (b) Values are means±s.e.m. of DFCP1, WIPI2 and ATG16 spots per cell in a, from at least six fields with 5–10 cells each. (c) HEK293 cells were transfected with δCOP (siδCOP), β'COP (siβ'COP) or non-targeted (siNT) siRNA, starved, immunolabelled for WIPI2 and imaged by wide-field microscopy. Arrows point at WIPI2 ring-like structures. Bar corresponds to 10 μm. (d) Values are means±s.e.m. of WIPI2 rings per cell in c, for 10 different fields with 5–15 cells each. (e) HEK293 cells were pre-treated for 3 h with 3 μg ml−1 BFA, starved, immunolabelled for WIPI2 and imaged by wide-field microscopy. Values are means±s.e.m. of WIPI2 rings per cell, for 10 different fields with 5–15 cells each. (f,g) HEK293 cells stably expressing GFP-ATG13 (f) or GFP-DFCP1 (g) were pre-treated for 3 h with 3 μg ml−1 BFA, starved and live-imaged in the presence of BFA by wide-field microscopy. The lifespan of ATG13 and DFCP1 particles was quantitated. Values are means±s.e.m. of ATG13 or DFCP1 particle lifespan, from 60 and 30 montages, respectively. (h,i) HEK293 cells expressing stably GFP-ATG13 (h) or GFP-DFCP1 (i) and transiently CFP-LC3 were pre-treated for 3 h with 3 μg ml−1 BFA, starved and live-imaged in the presence of BFA by wide-field microscopy. The lifespan of ATG13 and DFCP1 particles before the appearance of LC3 was quantitated. Values are means±s.e.m. of ATG13 or DFCP1 particle lifespan before the appearance of LC3, from 20 and 26 montages, respectively. Significance levels were determined with unpaired t-tests. *P=0.05%; **P=0.01%; ***P=0.001%; ****P=0.0001%.
Figure 4
Figure 4. ATG9 promotes the formation of ATG13 puncta.
(a) HEK293 cells were either fed or starved for 1 h, immunolabelled for ATG13 and ATG9 and imaged by wide-field microscopy. Arrowheads in inserts point at ATG13 particles associating with ATG9. Bar corresponds to 10 μm. (b) Values are ATG13 particles in c,d associating with ATG9 particles in the first two frames from their emergence. From analysis of 75 montages. (c,d) Wide-field live-cell imaging of starved HEK293 cells stably expressing GFP-ATG13 and mRFP-ATG9. Representative montages of ATG13 particles forming in association with ATG9 (c) or not (d) are shown. Arrowheads point at the ATG13 particles in the first two frames from their emergence, the same that were used for the analysis in b. (e) Wide-field live-cell imaging of starved HEK293 cells expressing stably GFP-ATG13 and mRFP-ATG9, and transiently CFP-ER. Representative montage of ATG13 particle forming on a tubular extension of ER previously hosting an ATG9 vesicle is shown. Arrowheads point at the ATG13 particle in the first two frames from its emergence and at the associating extension of ER and ATG9 vesicle. (f,g) HEK293 cells were transfected with non-targeted (siNT) or ATG9 (siATG9) siRNA, starved for 1 h, immunolabelled for ATG13 or WIPI2 and imaged by confocal laser scanning microscopy. Values are means±s.e.m. puncta of ATG13 (f) or WIPI2 (g) per cell, for at least five different fields with 15–30 cells each. Significance levels were determined with unpaired t-tests. Bar in ce corresponds to 300 nm. **P=0.01%; ***P=0.001%.
Figure 5
Figure 5. Combination of ERES-ATG9-VMP1 compartments can only partially predict the site of autophagosome nucleation.
(a) HEK293 cells stably expressing GFP-ATG13 were fed or starved, immunolabelled for ATG9 and ERGIC53 and imaged by wide-field microscopy. Bar corresponds to 10 μm. (b,c) Wide-field live-cell imaging of starved HEK293 cells expressing stably GFP-ATG13 and transiently VMP1-mCherry. Representative montages of ATG13 particles forming in association with VMP1 (b) or not (c) are shown. Arrowheads point at the ATG13 particles in the first two frames from their emergence, the same that were used for the analysis in f. (d) HEK293 cells transiently expressing VMP1-YFP were immunolabelled for ubiquitin and imaged by wide-field microscopy. Representative images are shown. Bar corresponds to 10 μm. (e) Wide-field live-cell imaging of starved HEK293 cells expressing stably GFP-ATG13 and mRFP-ATG9 and transiently CFP-SEC16 and VMP1-LSS-mKate2. Representative images of a cell expressing the four proteins are shown. Bar corresponds to 10 μm. (f) Values are ATG13 particles in b,c associating with VMP1 in the first two frames from their emergence. From analysis of 67 montages. (g,h) Values are ATG13 particles associating with any of ATG9, SEC16 and VMP1 (g) or with different combinations of them (h) in the first two frames from their emergence. Bar in b,c corresponds to 300 nm.
Figure 6
Figure 6. ATG13 shows unique distribution pattern on autophagosome membranes.
(a) HEK293 cells were fed or starved in the presence or absence of VPS34 inhibitor for 1 h, immunolabelled for endogenous ATG13 and imaged by dSTORM. The structures of observed ATG13 particles under starved conditions were assigned to four different patterns: crescent shaped (a), semi-spherical (b), quasi-spherical (c) and spherical (d). Representative examples of reconstructed super-resolution images are shown for each pattern. Shapes below the images describe the outline of each observed pattern. Red circles within the spherical pattern correspond to areas of higher density of identified molecules. Values are the percentage of ATG13 particles corresponding to each pattern; from 120 particles analysed. (b) HEK293 cells stably expressing GFP-DFCP1 or GFP-ATG13, or the parental cell line were starved, immunolabelled for ATG13, WIPI2, ATG16 or GFP and imaged by dSTORM. Representative examples of reconstructed super-resolution images are shown. Bar corresponds to 0.15 μm. (c) The area occupied by ATG13 and ATG16 (labelled with Alexa Fluor 647- or CF 568- conjugated secondary antibody), WIPI2 or GFP-DFCP1 in the reconstructed super-resolution images in b was quantitated. Values are the ratios of ATG13–ATG16, WIPI2 and DFCP1 in each of the analysed particles. Significance levels were determined with one-sample t-test against a theoretical mean of 1 (if ATG13 and ATG16, WIPI2 or DFCP1 occupied the same area), with Bonferroni correction for multiple comparisons. ****P=0.0001%.
Figure 7
Figure 7. Autophagosomes associate with ATG9 and ERGIC membrane compartments.
(a,b) HEK293 cells were starved in the presence or absence of VPS34 inhibitor for 1 h, immunolabelled for ATG13 and ATG9 (a) or FIP200 and ERGIC53 (b), and imaged by dSTORM. (c,d) HEK293 cells stably expressing GFP-ATG13 were starved in the presence or absence of Vps34 inhibitor for 1 h, immunolabelled for ATG13 and ATG9 (c) or SEC23 (d), and imaged by dSTORM. Conventional images and super-resolution magnifications are shown. Scale bars in wide-field images: 5 μm. Scale bars in super-resolution images, 0.5 μm.
Figure 8
Figure 8. dSTORM imaging of ERGIC.
Parental HEK293 cells (a,b,d) or HEK293 cells stably expressing GFP-DFCP1 (c) were starved, immunolabelled for ERGIC53 and ATG9 (a), SEC23 (b), GFP(c) or ATG16 (d) and imaged by dSTORM. Representative conventional images and super-resolution magnifications are shown. Scale bars in wide-field images, 5 μm. Scale bars in super-resolution images, 0.5 μm.
Figure 9
Figure 9. ATG13 targets the ER.
(ad) HEK293 cells expressing stably GFP-ATG13 and transiently mCherry-dgk1 (ER marker) were starved, live-imaged by wide-field microscopy, fixed on stage and immunolabelled for ATG13 (secondary antibody conjugated to Alexa Fluor 647). The cells were relocated and imaged by SIM (for mCherry and Alexa Fluor 647) and dSTORM (for Alexa Fluor 647). Montages of representative ATG13 particle formation events from the live-cell imaging step (i), different z stacks from the SIM step (ii) and blow-ups of the ATG13 particles from the super-resolution dSTORM images (iii) are shown. Each figure (ad) corresponds to an independent example. (e) HEK293 cells expressing transiently GFP-dgk1 (ER marker) were starved, immunolabelled for GFP and imaged by dSTORM. Two representative examples are shown. Bars in SIM images correspond to 1 μm.
Figure 10
Figure 10. Correlative light and electron microscopy of ATG13 and ER.
HEK293 cells stably expressing GFP-ATG13 and transiently expressing mCherry-dgk1 (ER marker) were starved, subjected to live-cell imaging by wide-field microscopy and fixed on stage. (a) Fluorescent images of the frame capture just before the fixation, × 100 and × 10 DIC images of the fixed cells are shown. Red box in × 10 DIC image indicates the cell of interest. (b) Image of the resin-embedded sample. Cell of interest located in red box. (c) Resin blocks were trimmed down to a block face of 1 mm2 and mounted on stub for imaging in an Auriga focused ion beam scanning electron microscopy (FIB-SEM, Carl Zeiss). Overview images before (left) and after milling (right) indicating the cell of interest with a red box. (d) Montage of an ATG13 particle formation from the live-cell imaging step and z stacks after fixation (particle ii in f). (e) Overlays of light and electron microscopy images. Light and electron microscopy images were correlated using landmarks identified in both (shown in white and green lines, circles and triangles). (f) Three-dimensional (3D) opacity rendering of the FIB-SEM image stack. The areas outlined in red within the green boxes indicate ATG13 particles. Particle ii is the one that could be traced throughout the experiment and was identified in both live-cell and FIB-SEM imaging. ATG13 Particles in boxes i and iii could be identified from the wide-field and fluorescence image, but their provenance by live imaging could not because they were on a different focal plane from particle ii. (g) Magnification of the area within the green boxes in f (i–iii). Shown are the XY view from the middle of the ATG13 signal, and orthogonal XZ and YZ views along the thin white lines. (h) 3D Opacity rendering of the cropped FIB-SEM stacks in g with overlay of the ATG13 signal (red). Rendered in green are the membranes detected in the FIB-SEM stack that are in proximity of the ATG13 particle. Stars indicate mitochondrial membranes. Bars: 10 μm (a), 50 μm (b), 5 μm (de), 1 μm (f) and 0.25 μm (g).

References

    1. Burman C. & Ktistakis N. T. Autophagosome formation in mammalian cells. Semin. Immunopathol. 32, 397–413 (2010). - PubMed
    1. Lionaki E., Markaki M. & Tavernarakis N. Autophagy and ageing: insights from invertebrate model organisms. Ageing Res. Rev. 12, 413–428 (2013). - PubMed
    1. Mizushima N. & Komatsu M. Autophagy: renovation of cells and tissues. Cell 147, 728–741 (2011). - PubMed
    1. Harris H. & Rubinsztein D. C. Control of autophagy as a therapy for neurodegenerative disease. Nat. Rev. Neurol. 8, 108–117 (2012). - PubMed
    1. Mah L. Y. & Ryan K. M. Autophagy and cancer. Cold Spring Harb. Perspect. Biol 4, a008821 (2012). - PMC - PubMed

Publication types

MeSH terms

Substances