. 2016 Aug 11:6:31482.
doi: 10.1038/srep31482.

Leucine Zipper-bearing Kinase promotes axon growth in mammalian central nervous system neurons

Affiliations

Leucine Zipper-bearing Kinase promotes axon growth in mammalian central nervous system neurons

Meifan Chen et al. Sci Rep. .

Abstract

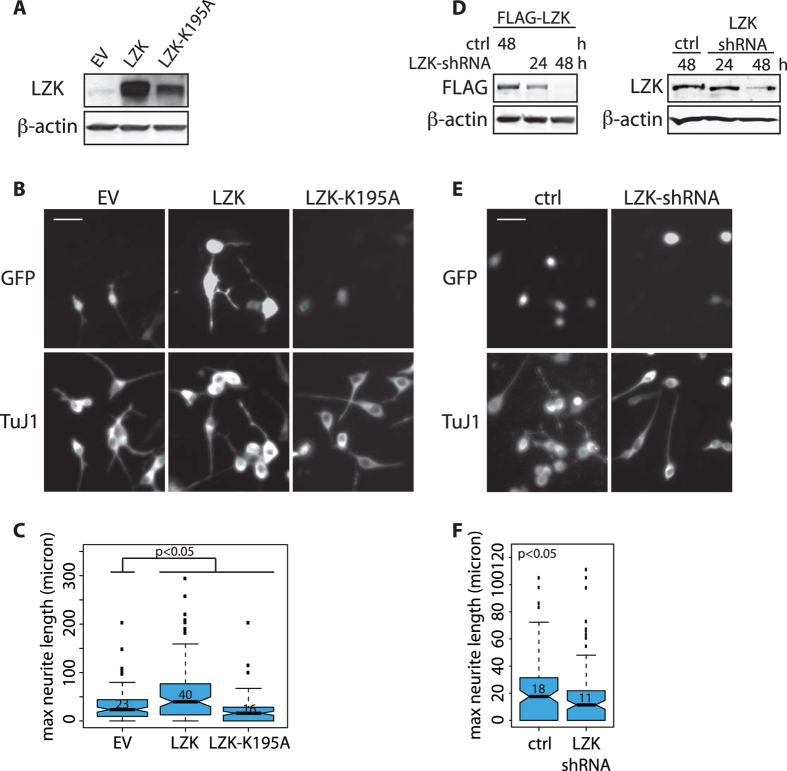
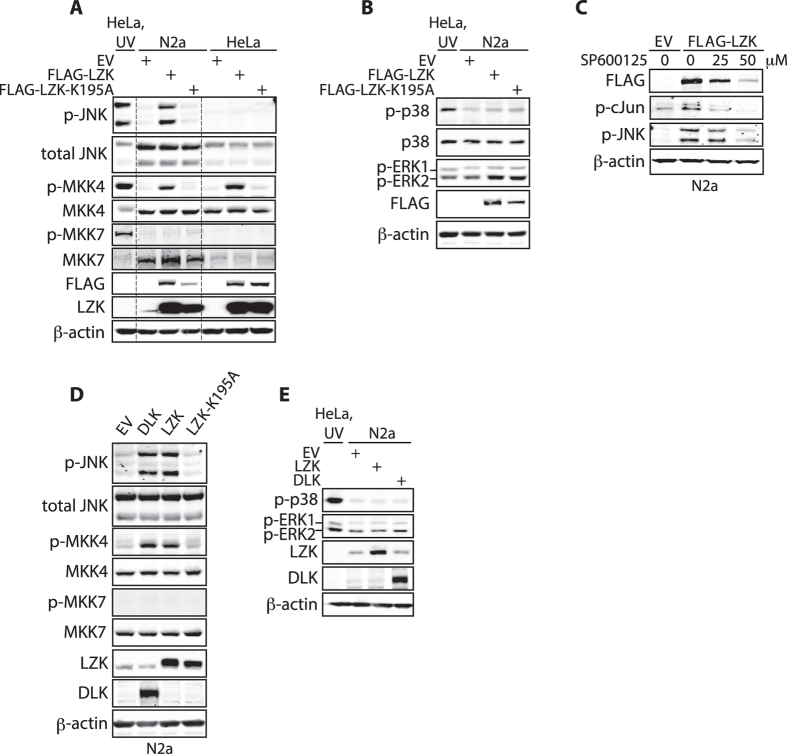
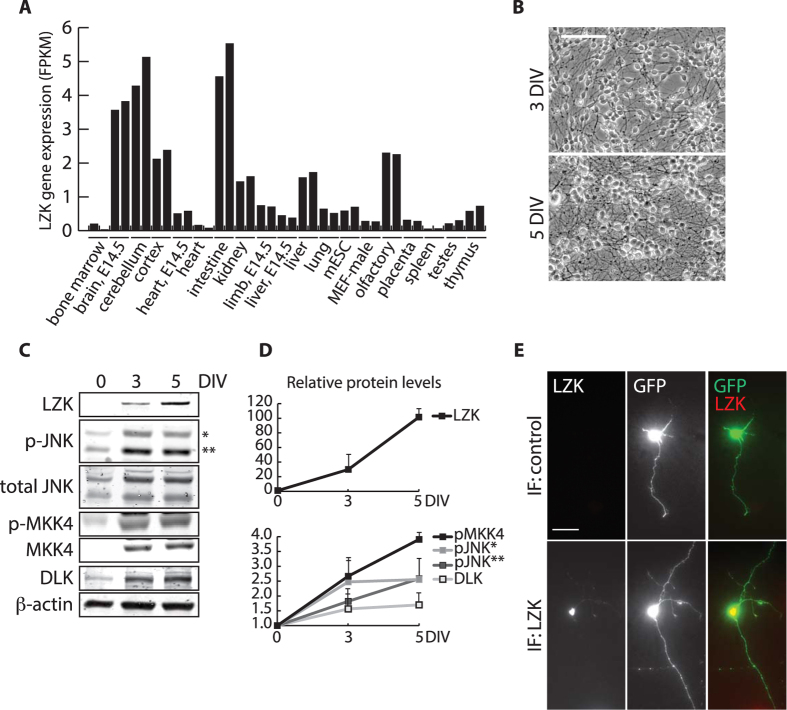
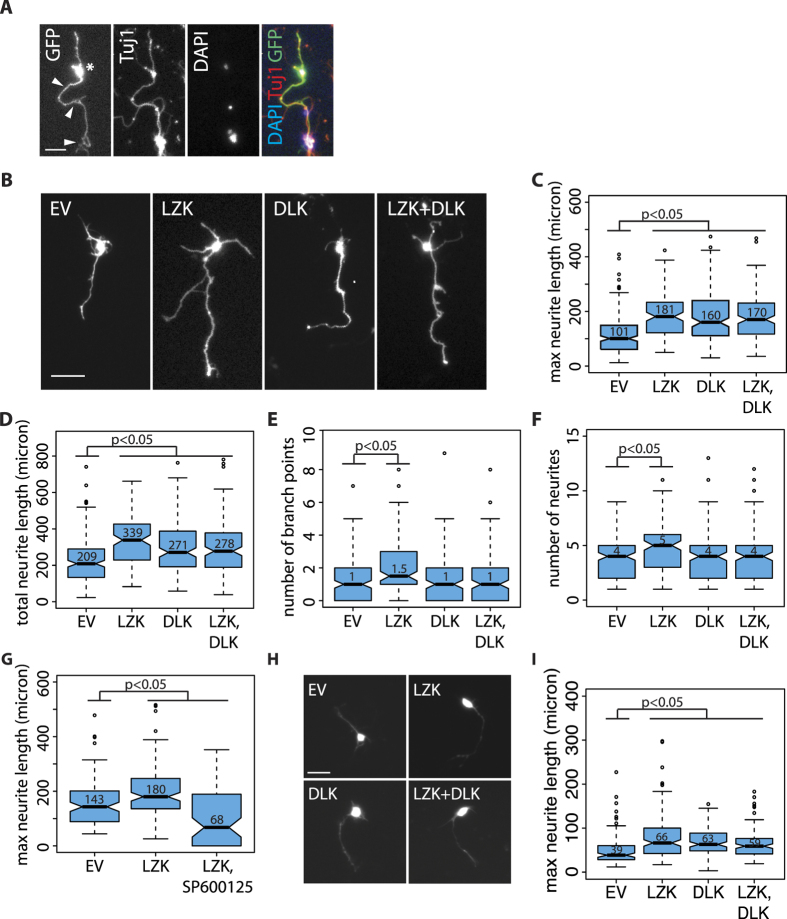
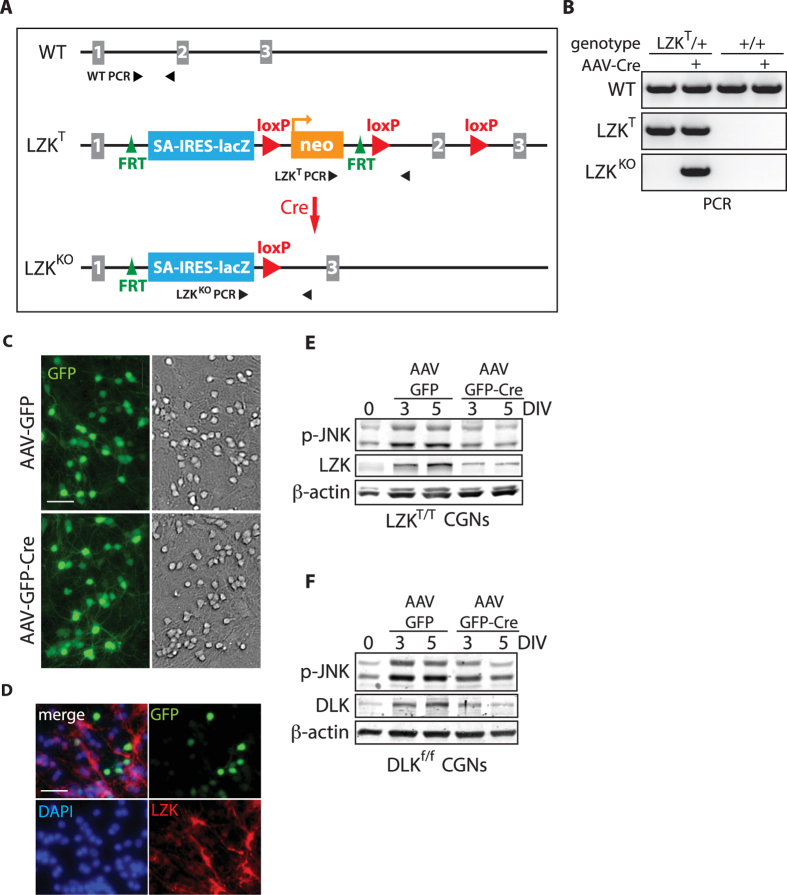
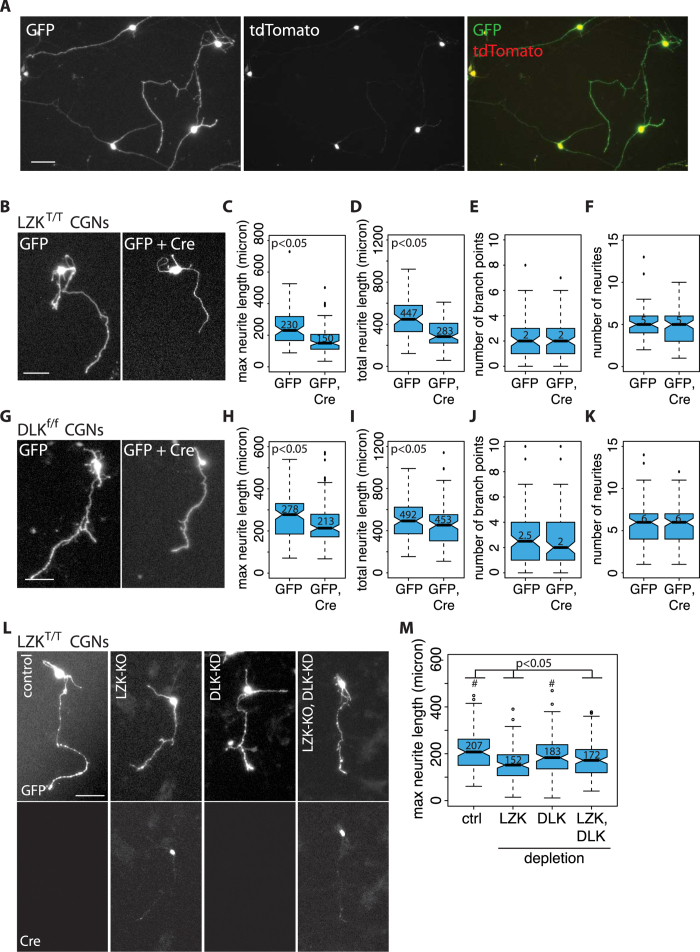
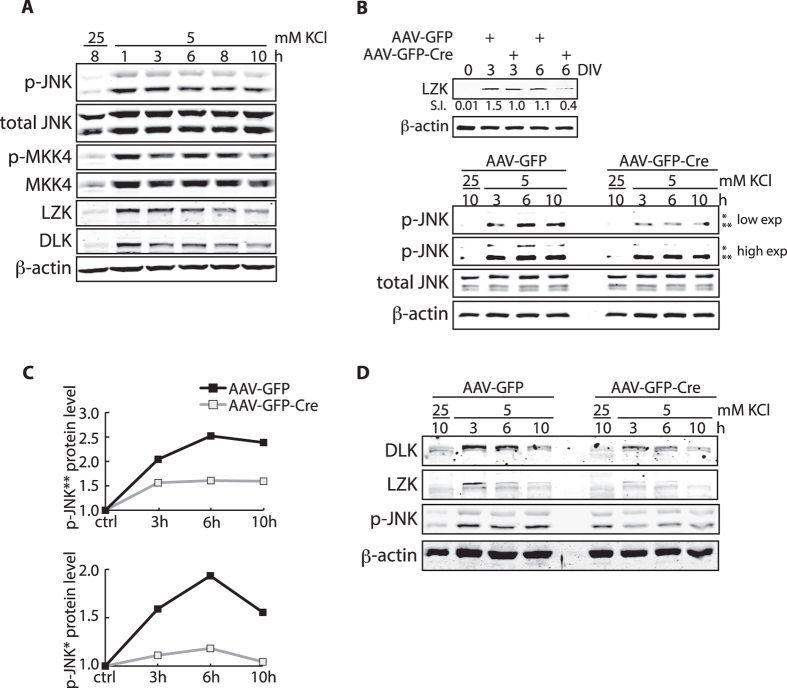
Leucine Zipper-bearing Kinase (LZK/MAP3K13) is a member of the mixed lineage kinase family with high sequence identity to Dual Leucine Zipper Kinase (DLK/MAP3K12). While DLK is established as a key regulator of axonal responses to injury, the role of LZK in mammalian neurons is poorly understood. By gain- and loss-of-function analyses in neuronal cultures, we identify LZK as a novel positive regulator of axon growth. LZK signals specifically through MKK4 and JNKs among MAP2Ks and MAPKs respectively in neuronal cells, with JNK activity positively regulating LZK protein levels. Neuronal maturation or activity deprivation activates the LZK-MKK4-JNK pathway. LZK and DLK share commonalities in signaling, regulation, and effects on axon extension. Furthermore, LZK-dependent regulation of DLK protein expression and the lack of additive effects on axon growth upon co-manipulation suggest complex functional interaction and cross-regulation between these two kinases. Together, our data support the possibility for two structurally related MAP3Ks to work in concert to mediate axonal responses to external insult or injury in mammalian CNS neurons.


Figures

Figure 1
Figure 1. LZK promotes neurite growth in N2a cells in a cell-autonomous manner.
(A) N2a cells were transiently transfected with GFP-coexpressing pBI empty vector (EV), pBI-LZK, or pBI-LZK-K195A catalytically inactive mutant. Total cell lysates were immunoblotted for LZK to confirm exogenous LZK expression 24 hours after transfection. For all immunoblots presented in this paper, gels shown in the same figure were run under the same experimental conditions. Blots shown within bounded regions were not cropped and spliced together. (B) N2a cells transfected with pBI empty vector (EV), pBI-LZK, or pBI-LZK-K195A were immunostained for TuJ1. Immunofluorescence images show GFP labeling of cells expressing the indicated pBI vectors and TuJ1 staining of cells with neuronal identity. Scale bar = 20 μm. (C) Graph compares the median maximum (max) neurite lengths of GFP and TuJ1-double positive N2a cells transfected with the indicated pBI vectors. Measurement was based on GFP. Median values are shown for each condition within the graph. Boxplot edges extend to the 25th and 75th percentiles; whiskers extend to non-outliner extremes; points beyond whiskers represent outliners. p-values by Wilcoxon test, n > 100 neurons per condition. (D) Left, Knockdown efficiency of GIPZ-LZK-shRNA coexpressing GFP was tested against exogenous FLAG-LZK in N2a cells. Cells were co-transfected with FLAG-LZK and GIPZ-LZK-shRNA. Total lysates were collected at the indicated times post-transfection and immunoblotted for the indicated proteins. Right, To test the knockdown efficiency on endogenous LZK, N2a cells were transfected with GFP-coexpressing GIPZ-nonsilencing-shRNA (ctrl) or pGIPZ-LZK-shRNA. At the indicated times after transfection, total lysates were immunoblotted for endogenous LZK. (E) N2a cells transfected with GIPZ-nonsilencing-shRNA (ctrl) or GIPZ-LZK-shRNA were immunostained for TuJ1. Representative immunofluorescence images show GFP labeling of transfected cells and TuJ1 staining of cells with neuronal identity. Scale bar = 20 μm. (F) Graph compares the median maximum (max) neurite lengths of GFP- and TuJ1- double positive N2a cells transfected with the indicated vectors. Measurement was based on GFP. Median values are shown for each condition within the graph. Boxplot edges extend to the 25th and 75th percentiles; whiskers extend to non-outliner extremes; points beyond whiskers represent outliners. p-values by Wilcoxon test, n > 100 cells per condition.
Figure 2
Figure 2. LZK signals through endogenous MKK4-JNKs and JNK inhibition reduces LZK protein levels in N2a cells.
(A) N2a and HeLa cells were transfected with empty vector (EV), FLAG-LZK, or FLAG-LZK-K195A. HeLa cells collected 45 min after UV irradiation at 45 J/m2 served as positive control for activation of endogenous JNK1/2, p38, and MKK4. Total cell lysates were immunoblotted for the indicated proteins. p-JNK indicating phospho-(Thr183/Tyr185)-JNK1/2; p-MKK4 indicating phospho-(Ser257)-MKK4. (B) Total lysates from N2a cells transfected with empty vector (EV), FLAG-LZK, or FLAG-LZK-K195A were immunoblotted for the indicated proteins. p-P38 indicates phospho-(Thr180/Tyr182)-p38; p-ERK1/2 indicates phospho-(Thr202/Tyr204)-ERK1/2. (C) N2a cells were transfected with empty vector (EV) or FLAG-LZK and treated with SP600125 at the indicated doses at the time of transfection. Total cell lysates were immunoblotted for the indicated proteins. p-cJun indicates phospho-(Ser63)-c-Jun. (D) Total lysates of N2a cells overexpressing empty vector (EV), DLK, LZK, or LZK-K195A were immunoblotted for the indicated proteins. (E) Total lysates of N2a cells overexpressing empty vector (EV), DLK, or LZK were immunoblotted for the indicated proteins.
Figure 3
Figure 3. Neuronal maturation-dependent upregulation of LZK-MKK4-JNK in cerebellar granule neurons.
(A) Graph compares gene expression of LZK in nineteen tissues from adult and embryonic (E14.5) mice based on published RNA-Seq dataset. Each tissue sample was run in duplicates. LZK expression level is presented as fragments per kilobase of exon per million fragments mapped (FPKM). (B) Bright field images show axon growth of primary cerebellar granule neurons (CGNs) isolated from postnatal (P7) mice cultured for 3 and 5 days in vitro (DIV). Scale bar = 50 μm. (C) Total cell lysates from CGNs cultured for 0 (freshly dissociated cells before plating), 3, and 5 DIV were immunoblotted for the indicated endogenous proteins. *JNK 54 kDa isoform; **JNK 46 kDa isoform. (D) Based on (C) graphs show immunoblot signal-based quantification of endogenous LZK, p-JNK1/2, and p-MKK4 protein levels that were first normalized to β-actin in the corresponding samples, followed by subsequent normalization of this ratio on 3 and 5 DIV to that of 0 DIV (presented as baseline of 1 on graphs). *JNK 54 kDa isoform; **JNK 46 kDa isoform. (E) CGNs transfected with pBI empty vector expressing GFP for visualization of cell morphology were cultured for 3 DIV and immunostained for endogenous LZK (top panel), or with secondary antibody only as negative control (bottom panel). Scale bar = 50 μm.
Figure 4
Figure 4. LZK overexpression enhances axon growth in mouse central nervous system neurons.
(A) For in vitro axon growth assays of CGNs, axon lengths of GFP and TuJ1-double positive cells indicative of pBI expression and neuronal identity respectively were quantified. Measurement was based on GFP. Asterisk marks cell body; white arrowheads point to the longest axon. Scale bar = 20 μm. (B) CGNs from wild-type mice were transfected with the indicated pBI plasmids. Images show GFP-positive CGNs with maximum axon lengths representative of the median values in the corresponding conditions. Scale bar = 50 μm. (C–F) Boxplots quantify maximum axon lengths (C) total neurite lengths (D) number of branch points (E) and number of neurites per neuron (F) in CGNs transfected with the indicated pBI vectors. For all boxplots, median values for each condition are shown within graphs. EV indicates empty vector. All boxplot edges extend to the 25th and 75th percentiles; whiskers extend to non-outliner extremes; points beyond whiskers represent outliners. p-values by Wilcoxon test; n = 120–160 neurons per condition. (G) Boxplot quantifies maximal axon growth of P7 CGNs treated with 25 μM JNK inhibitor SP600125 upon transfection with the indicated pBI vectors. EV indicates empty vector. (H) Hippocampal neurons isolated from wild-type postnatal day 6 (P6) mice were transfected with the indicated pBI plasmids. EV is empty vector negative control. Images show GFP-positive hippocampal neurons indicative of transfection with pBI vectors. Scale bar = 20 μm. (I) Boxplot quantifies maximum axon lengths in hippocampal neurons transfected with the indicated pBI vectors shown in (H).
Figure 5
Figure 5. Generation and validation of LZK mutant mice and impaired JNK activation in LZK mutant CGNs.
(A) Illustration of the LZK wild-type (WT), targeted (LZKT) and null/knockout (LZKKO) alleles. The first three exons of LZK are shown as grey rectangles. FRT, flippase (FLP) recognition site; SA, En-2 gene splice acceptor; IRES, internal ribosomal entry site. The LZKT allele contains three loxP sites, two of which flank exon 2, with the third upstream of β-actin promoter driven neomycin resistance gene (neo). Efficient Cre-mediated recombination between loxP sites would excise neo and exon 2 to create a null LZKKO allele. Pairs of small black arrowheads indicate primer pairs for genotyping PCR. Allelic elements are not drawn to scale. (B) Validation of Cre-dependent conversion of LZKT to LZKKO allele in vitro by PCR. Primary CGNs isolated from mice of the indicated genotype were left untreated or treated with AAV-Cre. Genomic DNA was isolated from each condition and subjected to PCR targeting the WT, LZKT or LZKKO allele. (C) CGNs from LZKT/T mice were infected with AAV-GFP or AAV-GFP-Cre 40 hours after plating and fixed on 5 DIV. (A) Based on the ratio of GFP-positive CGNs to total number of CGNs in bright field microscopy, infection efficiency of AAV-GFP and AAV-GFP-Cre are 64 and 63% respectively. Scale bar = 20 μm. (D) Visualization of LZK depletion in AAV-GFP-Cre infected CGNs by immunofluorescent staining of endogenous LZK. Scale bar = 20 μm. (E) CGNs purified from LZKT/T mice were infected with control AAV-GFP or AAV-GFP-Cre to deplete LZK. Total cell lysates were collected on the indicated days in vitro (DIV) and immunoblotted for the indicated proteins. (F) CGNs from DLKf/f mice were infected with control AAV-GFP or AAV-GFP-Cre to deplete DLK. Total cell lysates were collected on the indicated days in vitro (DIV) and immunoblotted for the indicated proteins.
Figure 6
Figure 6. LZK depletion impairs axon growth of cerebellar granule neurons isolated from LZKT mice.
(B) CGNs from LZKT/T mice were co-transfected with pMAX-GFP and pCAG-Cre at 1:3 ratio to generate GFP-labeled LZKKO/KO CGNs. Images show GFP-positive CGNs with maximum axon lengths representative of the median values in the corresponding conditions. Scale bar = 50 μm. Boxplot quantifies maximum axon lengths (C) total neurite lengths (D) branching (E) and total number of neurites (F) in LZKT/T CGNs co-transfected with the indicated vectors. Median values are shown for each condition within the graph. (G) CGNs from DLKf/f mice were co-transfected with pMAX-GFP and pCAG-Cre as in (B). Images show GFP-positive CGNs with maximum axon lengths representative of the median values in the corresponding conditions. Scale bar = 50 μm. Boxplot quantifies maximum axon lengths (H) total neurite lengths (I) branching (J) and total number of neurites (K) of DLKf/f CGNs co-transfected with the indicated vectors. Median values are shown for each condition within the graphs. n > 100 neurons per condition. (L) LZKT/T CGNs were transfected with pGIPZ empty plasmid (control), pGIPZ and Cre (LZK-KO), pGIPZ-DLK-shRNA (DLK-shRNA), or Cre and pGIPZ-DLK-shRNA (LZK-KO, DLK-shRNA). (Left) pGIPZ plasmids co-express GFP to fluorescently label transfected cells. Cre expression was visualized by immunofluorescence staining. GFP-positive CGNs with maximum axon lengths representative of the median values in the corresponding conditions are shown. Scale bar = 50 μm. Quantification of maximum axon lengths shown in (M). Median values are shown for each condition within the graphs. All boxplot edges extend to the 25th and 75th percentiles; whiskers extend to non-outliner extremes; points beyond whiskers represent outliners. p-values by Wilcoxon test, n > 100 neurons per condition.
Figure 7
Figure 7. Silencing of neuronal activity by potassium withdrawal leads to LZK-dependent activation of JNKs in cerebellar granule neurons.
(A) CGNs from wild-type mice were maintained in media containing 25 mM KCl for five days. Potassium withdrawal was performed by switching to media containing 5 mM KCl without serum as previously described on day 6. CGNs were collected at the indicated times following potassium withdrawal and total cell lysates were immunoblotted for the indicated endogenous proteins. (B) LZKT/T CGNs were infected with AAV-GFP or AAV-GFP-Cre 40 hours after plating. Top panel, total cell lysates collected on 0, 3, 6 DIV were immunoblotted for endogenous LZK to assay LZK depletion in the total cell population. Immunoblot-based quantification of signal intensity (S.I.) of endogenous LZK protein levels normalized to that of β-actin is shown. Bottom panel, AAV-GFP or AAV-GFP-Cre infected LZKT/T CGNs were subjected to potassium withdrawal on 6 DIV. Total cell lysates collected at the indicated times following treatment were immunoblotted for the indicated endogenous proteins. Two different exposures (low and high) for p-JNK2 and p-JNK1 are shown for better comparison. *JNK 54 kDa isoform; **JNK 46 kDa isoform. (C) Graphs quantify endogenous p-JNK protein levels from the bottom panel in (B). Immunoblot-based quantification of JNK protein expression was first normalized to β-actin in the corresponding sample, and shown as a value relative to the control (presented as baseline of 1). (D) LZKT/T CGNs were infected with control AAV-GFP or AAV-GFP-Cre 40 h after plating. AAV-infected LZKT/T CGNs were subjected to potassium withdrawal on 6 DIV. Total cell lysates collected at the indicated times following treatment were immunoblotted for the indicated endogenous proteins.

References

    1. Sakuma H. et al.. Molecular cloning and functional expression of a cDNA encoding a new member of mixed lineage protein kinase from human brain. J. Biol. Chem. 272, 28622–28629 (1997). - PubMed
    1. Gallo K. A. & Johnson G. L. Mixed-lineage kinase control of JNK and p38 MAPK pathways. Nat. Rev. Mol. Cell Biol. 3, 663–672 (2002). - PubMed
    1. Nihalani D., Merritt S. & Holzman L. B. Identification of structural and functional domains in mixed lineage kinase dual leucine zipper-bearing kinase required for complex formation and stress-activated protein kinase activation. J. Biol. Chem. 275, 7273–7279 (2000). - PubMed
    1. Nakata K. et al.. Regulation of a DLK-1 and p38 MAP kinase pathway by the ubiquitin ligase RPM-1 is required for presynaptic development. Cell 120, 407–420 (2005). - PubMed
    1. Collins C. A., Wairkar Y. P., Johnson S. L. & DiAntonio A. Highwire restrains synaptic growth by attenuating a MAP kinase signal. Neuron 51, 57–69 (2006). - PubMed

Publication types

Substances