. 2016 Sep 15;197(6):2500-8.
doi: 10.4049/jimmunol.1600628. Epub 2016 Aug 10.

Systems Analysis of the Complement-Induced Priming Phase of Liver Regeneration

Affiliations

Systems Analysis of the Complement-Induced Priming Phase of Liver Regeneration

Jun S Min et al. J Immunol. .

Abstract

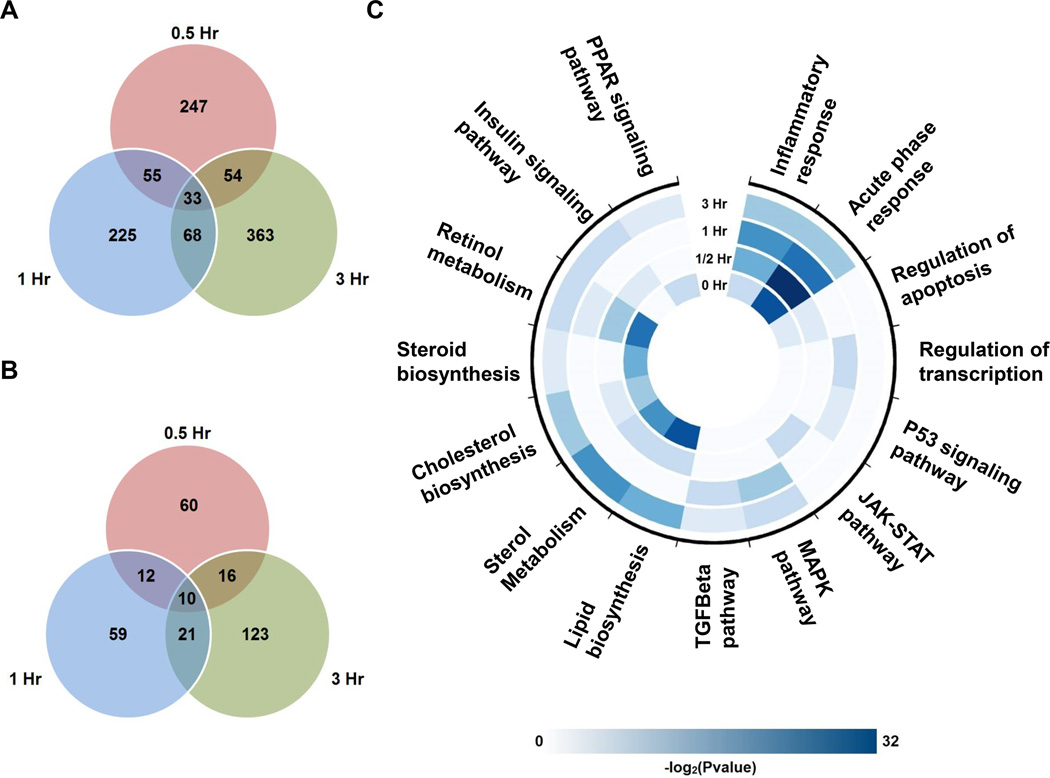
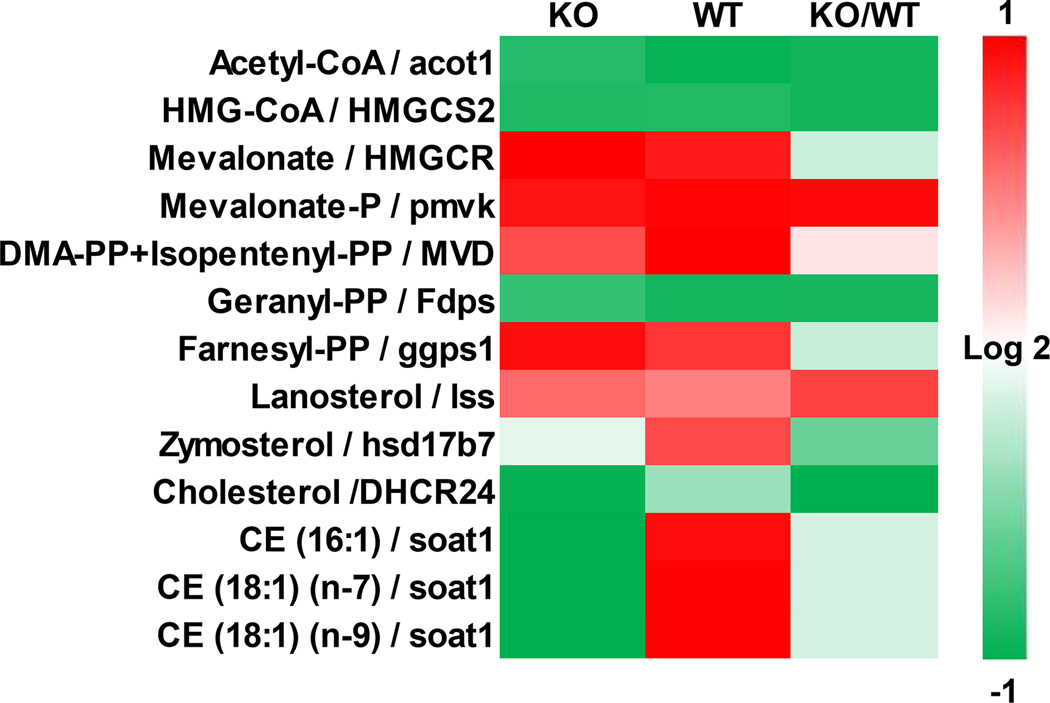
Liver regeneration is a well-orchestrated process in the liver that allows mature hepatocytes to reenter the cell cycle to proliferate and replace lost or damaged cells. This process is often impaired in fatty or diseased livers, leading to cirrhosis and other deleterious phenotypes. Prior research has established the role of the complement system and its effector proteins in the progression of liver regeneration; however, a detailed mechanistic understanding of the involvement of complement in regeneration is yet to be established. In this study, we have examined the role of the complement system during the priming phase of liver regeneration through a systems level analysis using a combination of transcriptomic and metabolomic measurements. More specifically, we have performed partial hepatectomy on mice with genetic deficiency in C3, the major component of the complement cascade, and collected their livers at various time points. Based on our analysis, we show that the C3 cascade activates c-fos and promotes the TNF-α signaling pathway, which then activates acute-phase genes such as serum amyloid proteins and orosomucoids. The complement activation also regulates the efflux and the metabolism of cholesterol, an important metabolite for cell cycle and proliferation. Based on our systems level analysis, we provide an integrated model for the complement-induced priming phase of liver regeneration.


Figures

Figure 1
Figure 1
Venn diagrams of differentially regulated genes after PHx under the p-value cutoff of 0.05 (A) and the FDR cutoff of 0.1 (B) and over-represented biological functions and pathways during the priming phase (C). A and B, all data are shown as the number of differentially regulated genes between the KO and the WT at each time point (n=8 (0.5 hr) and n=6 (1–3 hr) mice) C, Enrichment analysis was performed at each time point using DAVID from the list of differentially regulated genes under the p-value cutoff of 0.05. Negative log2 of enrichment p-value was used as the scale for the heatmap (enrichment p≤0.05, a modified Fisher exact test from DAVID)
Figure 2
Figure 2
Temporal network analysis in Cytoscape. The networks represent the biggest module derived from Autosome clustering at 4 time points. This particular network of 41 genes shows significant enrichment in transcription (FDR<0.1, DAVID). The red color indicates fold upregulation in the KO, whereas the green indicates fold downregulation, with respect to the WT. The size of a node is based on the number of directly connected genes. The solid line indicates protein-protein interaction (PPi), whereas the directed dashed line indicates transcription factor-target interaction (TFi). The diamond shape represents differentially regulated genes, either under the p-value of 0.05 or the FDR of 0.1, at that particular time point between the KO and the WT.
Figure 3
Figure 3
Acute phase genes after PHx. Heatmaps of transcriptional changes in the known acute phase genes are plotted for KO, WT, and KO/WT fold change. Log2 color scale is used. *differentially regulated at all three time points.
Figure 4
Figure 4
Metabolic fold changes at 3 hours. KO/WT fold changes at 3 hours are shown for all 143 metabolites. Each blue dot represents the fold change of a single metabolite.
Figure 5
Figure 5
Correlation heatmap of gene-metabolite pairs in the sterol pathway. Pearson correlation coefficient was calculated for the measured gene-metabolite pairs in the sterol pathway. If multiple genes are known to regulate a metabolite, the pair with the highest correlation was chosen. The numbers of time points used for correlation calculation were 3, 3, and 4 for KO, WT, and KO/WT categories, respectively.
Figure 6
Figure 6
The proposed mechanism of the priming phase of complement-induced liver regeneration. Complement activation induced by liver injury or PHx increases the concentration of the complement effector proteins, C3a and C5a, which bind to the nearby Kupffer cells to release TNFα. TNFα then binds to the receptors on hepatocytes to initiate the MAPK pathway and its downstream immediate-early genes such as c-fos and SOCS3. This leads to activation of acute phase proteins such as SAA that can replace the lipoprotein of HDL to form acute-phase HDL. Acute-phase HDL promotes lower cholesterol efflux than native HDL, which causes hepatocytes to respond by activating LXR through oxysterols to reduce cholesterol biosynthesis for stable cholesterol levels. TNFα can also inhibit insulin signaling, potentially through the MAPK pathway, which then reduces the expression of HMGCR, a key enzyme in cholesterol biosynthesis. The reduced cholesterol biosynthesis allows hepatocytes to use their cellular resources to meet other metabolic demands required for upcoming prolonged proliferation of liver regeneration.

References

    1. Clavien PA. Liver regeneration: a spotlight on the novel role of platelets and serotonin. Swiss medical weekly. 2008;138:361–370. - PubMed
    1. Clavien PA, Petrowsky H, DeOliveira ML, Graf R. Strategies for safer liver surgery and partial liver transplantation. The New England journal of medicine. 2007;356:1545–1559. - PubMed
    1. Gotohda N, Iwagaki H, Ozaki M, Kinoshita T, Konishi M, Nakagohri T, Takahashi S, Saito S, Yagi T, Tanaka N. Deficient response of IL-6 impaired liver regeneration after hepatectomy in patients with viral hepatitis. Hepato-gastroenterology. 2008;55:1439–1444. - PubMed
    1. Hines IN, Kremer M, Isayama F, Perry AW, Milton RJ, Black AL, Byrd CL, Wheeler MD. Impaired liver regeneration and increased oval cell numbers following T cell-mediated hepatitis. Hepatology. 2007;46:229–241. - PubMed
    1. Tanemura A, Mizuno S, Wada H, Yamada T, Nobori T, Isaji S. Donor age affects liver regeneration during early period in the graft liver and late period in the remnant liver after living donor liver transplantation. World journal of surgery. 2012;36:1102–1111. - PubMed

Publication types

MeSH terms