. 2016 Aug 11:6:31360.
doi: 10.1038/srep31360.

A point mutation in AgrC determines cytotoxic or colonizing properties associated with phenotypic variants of ST22 MRSA strains

Affiliations

A point mutation in AgrC determines cytotoxic or colonizing properties associated with phenotypic variants of ST22 MRSA strains

Srikanth Mairpady Shambat et al. Sci Rep. .

Abstract

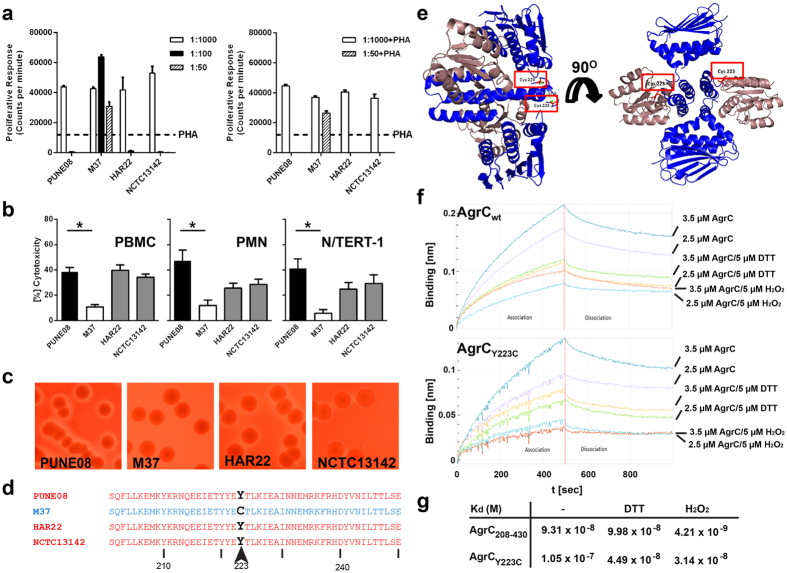
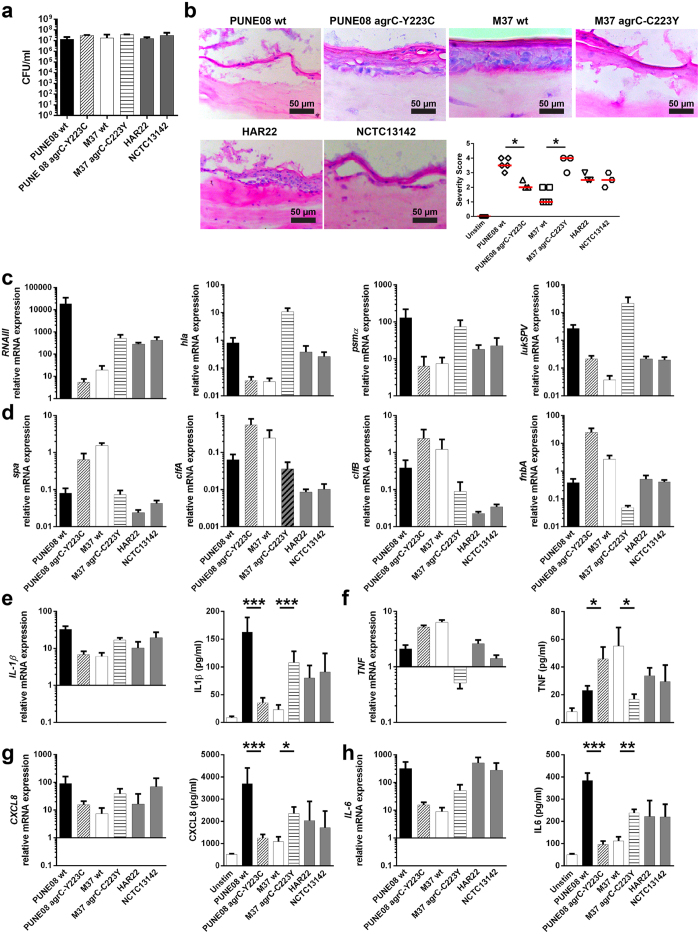
Methicillin-resistant Staphylococcus aureus (MRSA) is a major cause of skin and soft tissue infections. One of the highly successful and rapidly disseminating clones is MRSA ST22 commonly associated with skin tropism. Here we show that a naturally occurring single amino acid substitution (tyrosine to cysteine) at position 223 of AgrC determines starkly different ST22 S. aureus virulence phenotypes, e.g. cytotoxic or colonizing, as evident in both in vitro and in vivo skin infections. Y223C amino acid substitution destabilizes AgrC-AgrA interaction leading to a colonizing phenotype characterized by upregulation of bacterial surface proteins. The colonizing phenotype strains cause less severe skin tissue damage, show decreased susceptibility towards the antimicrobial LL-37 and induce autophagy. In contrast, cytotoxic strains with tyrosine at position 223 of AgrC cause infections characterized by inflammasome activation and severe skin tissue pathology. Taken together, the study demonstrates how a single amino acid substitution in the histidine kinase receptor AgrC of ST22 strains determines virulence properties and infection outcome.


Figures

Figure 1
Figure 1. Natural amino acid sequence variation in AgrC results in different phenotypic profiles of clinical S. aureus strains.
(a) Proliferative or cytotoxic responses by human peripheral blood mononuclear cells (PBMC) isolated from three healthy donors stimulated with indicated dilution series of bacterial supernatants prepared from overnight cultures of S. aureus strains. Stimulation without (left panel) and with (right panel) addition of PHA to each supernatant are shown. The data represent the mean values ± s.d. (n  =  3). (b) Cytotoxicity induced by bacterial supernatants of 1:50 dilutions towards PBMC, human neutrophils (PMN) and human keratinocytes (N/TERT-1). Mean values ± s.d. from four or more volunteers (PBMC, PMN) or experiments are shown (n ≥ 4). The statistical significance between PUNE08 and M37 strains was determined using two-tailed Mann-Whitney U-test (*p < 0.05). (c) Representative images of hemolysis on blood agar plates induced by indicated clinical S. aureus strains (see also Supplementary Fig. 1e). (d) Amino acid sequence analysis of AgrC from indicated strains at specified positions. (e) Theoretical side and front representation of AgrCY223C protein dimeric structure showing two cysteines at 223rd position which are placed ~15 Å apart. (f) Quantification of the interaction of recombinant wild-type AgrC (upper panel) and AgrCY223C (lower panel) (analytes) with immobilized AgrA (ligand) using bio-layer interferometry. (Note the difference in scale between upper panel and lower panel). Representative profiles of the relative bio-layer Interferometry responses for the association and dissociation of different analyte concentrations in combination with DTT and H2O2 are shown (n = 2). (g) The values for dissociation constant (Kd) were calculated from the binding data with the Octet Data Analysis Software v 8.0.
Figure 2
Figure 2. Phenotypic switch of the PUNE08 and M37 S. aureus strains due to direct substitution of tyrosine to cysteine or cysteine to tyrosine at the position 223 in AgrC.
(a) Amino acid sequence analysis of AgrC from indicated wild-type and respective mutant strains. (b) Representative images of hemolysis on blood agar plates induced by indicated wild-type and respective mutant S. aureus strains (see also Supplementary Fig. 1e). (c) Proliferative or cytotoxic responses by human PBMC isolated from three healthy donors stimulated with indicated dilution series of bacterial supernatants. Stimulation without (left panel) and with (right panel) addition of PHA to each supernatant are shown. The data represent the mean values ± s.d. (n  =  3). (d) Cytotoxicity induced by bacterial supernatants of 1:50 dilutions towards human PBMC, human neutrophils (PMN) and human keratinocytes (N/TERT-1). Mean values ± s.d. from four or more volunteers (PBMC, PMN) or experiments are shown (n ≥ 4). The statistical significance between wild-type and respective mutant strains was determined using two-tailed Mann-Whitney U-test (*p < 0.05; **p < 0.01; ***p < 0.001).
Figure 3
Figure 3. Differential gene expression and virulence profile in strains with different AgrC variants.
(a) Relative mRNA expression of indicated genes regulating or encoding exotoxins from stationary phase bacterial cultures. The data represent the mean values ± s.d. from three independent experiments (n = 3). (b) Relative mRNA expression of indicated genes encoding for surface-attached proteins from stationary phase bacterial cultures. The data represent the mean values ± s.d. from three independent experiments (n = 3). (c) Bacterial adherence to, internalization into (d) and cytotoxicity towards (e) human keratinocytes after two hours of infection. The data represent the mean values ± s.d. (n ≥ 4). The statistical significance between wild-type and respective mutant strains was determined using two-tailed Mann-Whitney U-test (**p < 0.01). (f) Representative images of Western Blot analyses of TNF-R1 and Caspase 1 subunits expression after 2 and 4 h of keratinocytes infection. β-actin was used as a loading control (n = 4). Uncropped full-size blots are shown in supplementary Fig. 2. (g) Representative images of caspase 1 activation after 2 h of keratinocytes monolayer infection with indicated strains (n = 3). (h) Quantitative analysis of caspase 1 positive cells after 2 h of infection. Number of cells were calculated in multiple fields (n = 5). The data represent the mean values ± s.d. from three independent infections (n = 3). The statistical significance between wild-type and respective mutant strains was determined using two-tailed Mann-Whitney U-test (***p < 0.001).
Figure 4
Figure 4. AgrC variation determines the severity of infection in skin tissue model.
(a) Total CFU counts of bacteria recovered from skin tissue models after 24 h of infection with indicated S. aureus strains. The data represent the mean values ± s.d. (n ≥ 3). (b) Histological analysis of the skin tissue models after infection. Representative images 24 h post infection and blinded scoring analysis with indicated strains are shown (n ≥ 3). Horizontal lines denote median values. The statistical significance between wild-type and respective mutant strains was determined using two-tailed Mann-Whitney U-test (*p < 0.05). (c) Relative mRNA expression of indicated genes regulating or encoding exotoxins during the 24 h skin tissue model infection. The data represent the mean values ± s.d. from three independent infections (n = 3). (d) Relative mRNA expression of indicated genes encoding for surface-attached proteins during the 24 h skin tissue model infection. The data represent the mean values ± s.d. from three independent infections (n = 3). (e) IL-1β, (f) TNF, (g) CXCL8, and (h) IL-6 relative mRNA expression compared to unstimulated model (black line; left panel) and protein (right panel) released in response to infection from skin tissue model supernatants. The data represent the mean values ± s.d. (n≥3). The statistical significance between wild-type and respective mutant strains was determined using two-tailed Mann-Whitney U-test (*p < 0.05; **p < 0.01; ***p < 0.001).
Figure 5
Figure 5. Bacterial intracellular localization and autophagy induction by strains with different AgrC variants.
(a,b) Representative micrographs and quantitative analysis of LAMP1 and S. aureus co-localization in infected keratinocytes monolayers after 2 h of infection. (c,d) Representative micrographs and quantitative analysis of LAMP1 and S. aureus co-localization in infected skin tissue models after 24 h of infection. (e–g) Representative micrographs, quantitative analysis of MFI of LC3AB, and analysis of LC3AB and S. aureus co-localization in infected keratinocytes monolayers after 2 h of infection. (h–j) Representative micrographs, quantitative analysis of MFI of LC3AB, and analysis of LC3AB and S. aureus co-localization in infected skin tissue models after 24 h of infection. (k) The MIC of LL-37 towards the S. aureus were determined from two independent experiments performed in triplicates. (aj) The data represent the mean values ± s.d. from three independent infections (n = 3). The statistical significance between wild-type and respective mutant strains was determined using two-tailed Mann-Whitney U-test (*p < 0.05; **p < 0.01; ***p < 0.001).
Figure 6
Figure 6. In vivo infections with S. aureus strains harboring tyrosine at position 223 of AgrC result in severe tissue damage.
(a) Bacterial loads and dissemination from indicated mice strains infected with indicated S. aureus strains. (b) Lesion sizes of indicated mice strains infected with indicated S. aureus strains at days 3 and 6 post infection. (c) Representative images of lesion sizes at day 6 post infection. In total, three mice strains (C57BL/6J [red], DBA/2J [blue], and BALB/c [black]) were used. From each group three mice were infected with indicated S. aureus strain and the infection was monitored over a period of six days. Each symbol represents one mouse and horizontal lines represent the median value. The statistical significance between wild-type and respective mutant strains was determined using two-tailed Mann-Whitney U-test (***p < 0.001).

References

    1. Monaco M., Pimentel de Araujo F., Cruciani M., Coccia E. M. & Pantosti A. Worldwide Epidemiology and Antibiotic Resistance of Staphylococcus aureus. Curr. Top. Microbiol. Immunol., 10.1007/82_2016_3 (2016). - DOI - PubMed
    1. Klevens R. M. et al.. Invasive methicillin-resistant Staphylococcus aureus infections in the United States. Jama 298, 1763–1771, 10.1001/jama.298.15.1763 (2007). - DOI - PubMed
    1. Rolo J. et al.. High genetic diversity among community-associated Staphylococcus aureus in Europe: results from a multicenter study. PLoS One 7, e34768, 10.1371/journal.pone.0034768 (2012). - DOI - PMC - PubMed
    1. Chen C. J. & Huang Y. C. New epidemiology of Staphylococcus aureus infection in Asia. Clin. Microbiol. Infect. 20, 605–623, 10.1111/1469-0691.12705 (2014). - DOI - PubMed
    1. Klevens R. M., Gorwitz R. J. & Collins A. S. Methicillin-resistant Staphylococcus aureus: a primer for dentists. J. Am. Dent. Assoc. 139, 1328–1337 (2008). - PubMed

Publication types

MeSH terms