Golgi membrane-associated degradation pathway in yeast and mammals
- PMID: 27511903
- PMCID: PMC5282831
- DOI: 10.15252/embj.201593191
Golgi membrane-associated degradation pathway in yeast and mammals
Abstract
Autophagy is a cellular process that degrades subcellular constituents, and is conserved from yeast to mammals. Although autophagy is believed to be essential for living cells, cells lacking Atg5 or Atg7 are healthy, suggesting that a non-canonical degradation pathway exists to compensate for the lack of autophagy. In this study, we show that the budding yeast Saccharomyces cerevisiae, which lacks Atg5, undergoes bulk protein degradation using Golgi-mediated structures to compensate for autophagy when treated with amphotericin B1, a polyene antifungal drug. We named this mechanism Golgi membrane-associated degradation (GOMED) pathway. This process is driven by the disruption of PI(4)P-dependent anterograde trafficking from the Golgi, and it also exists in Atg5-deficient mammalian cells. Biologically, when an Atg5-deficient β-cell line and Atg7-deficient β-cells were cultured in glucose-deprived medium, a disruption in the secretion of insulin granules from the Golgi occurred, and GOMED was induced to digest these (pro)insulin granules. In conclusion, GOMED is activated by the disruption of PI(4)P-dependent anterograde trafficking in autophagy-deficient yeast and mammalian cells.
Keywords: GOMED; Golgi membrane; anterograde trafficking; autophagy.
© 2016 The Authors.
Figures
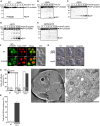
- A–E
GFP‐pho8Δ60‐expressing wild‐type (WT), atg5Δ, atg7Δ, and atg5Δpep4Δ cells were starved (A) or treated with AmphoB (B–E) and subjected to Western blotting. Cells were treated with 2.5 μg/ml AmphoB for the indicated time (B) or with the indicated doses for 24 h (C–E). Generation of free GFP was a marker of proteolysis.
- F
GFP‐pho8Δ60‐ and Pep4‐mRFP‐expressing atg5Δ cells were cultured with (AmphoB) or without (NT) AmphoB (2.5 μg/ml, 24 h), and localization of GFP‐pho8Δ60 and Pep4‐mRFP was observed by confocal microscopy. Arrowheads indicate the cells in which GFP‐pho8Δ60 was delivered to the vacuoles. Scale bars = 2 μm.
- G, H
Accumulation of autophagic body (AB)‐like structures by AmphoB in atg5Δpep4Δ cells. pep4Δ and atg5Δpep4Δ cells were starved for 3 h or treated with AmphoB (2.5 μg/ml, 24 h). Scale bars = 2 μm. Cells containing AB‐like structures were counted under phase‐contrast microscopy. Representative images (G) and the percentage of cells with AB‐like structures (H) are shown. *P < 0.01 versus the value of pep4Δ cells.
- I–K
Induction of AB‐like structures in atg5Δpep4Δ cells treated with AmphoB (2.5 μg/ml, 24 h). Representative images of quick‐frozen replicas (I) and thin section of the frozen‐substituted material (J) are shown. (I) AB‐like structures accumulated in the vacuole. Scale bar = 0.5 μm. (J) AB‐like structures containing lipid particles and mitochondria accumulated in the cross‐section of the vacuole. An autophagosome (AP)‐like double‐membrane compartment containing a ribosome and Golgi granule is present in the cytosol. Scale bar = 0.5 μm. A magnified photograph is available in Appendix Fig S4B. (K) The cells containing AB‐like structures were counted under electron microscopy [no treatment (NT): n = 20, AmphoB: n = 192]. *P < 0.01 versus the value of NT.

- A, B
Different source of AB‐like structure membrane from vacuolar membrane. (A) Morphological analysis of AB‐like structure membrane. Upper left: The same image as in Fig 1I is shown. Scale bar = 0.5 μm. Upper right: The magnified image shows the area indicated by the square in the upper left image. Scale bar = 0.2 μm. Lower panel: The P‐face (magnified image of the white solid square) and E‐face (magnified image of the white dotted square) of the AB‐like structure membranes contain a few intramembrane particles. Scale bars = 0.1 μm. (B) Morphological analysis of vacuolar membrane. Deep‐etched yeast cells (upper panel; scale bar = 0.5 μm). The P‐face (magnified image of the solid square) and E‐face (magnified image of the dotted square) of the vacuolar membranes contain numerous intramembrane particles. Scale bar = 0.1 μm.
- C–E
No involvement of microautophagy in AmphoB‐induced GOMED. (C) VTC4 is required for the AmphoB‐induced microautophagy in atg5Δpep4Δ cells. atg5Δpep4Δ cells and vtc4Δatg5Δpep4Δ cells were treated with AmphoB (2.5 μg/ml, 24 h). The number of cells with microautophagy was counted using EM images. Error bars indicate s.e.m. (atg5Δpep4Δ: n = 169, vtc4Δatg5Δpep4Δ: n = 45). (D) Absence of microautophagy, but not GOMED, in vtc4Δatg5Δpep4Δ cells treated with AmphoB (2.5 μg/ml, 24 h). Left panel: “V” indicates vacuole. Scale bar = 0.5 μm. Right panel: The magnified image of the dotted square is shown. Scale bar = 0.2 μm. Arrows indicate AB‐like structures. (E) GFP‐pho8Δ60‐expressing atg5Δ and vtc4Δatg5Δ cells were treated with AmphoB (2.5 μg/ml, 24 h) and subjected to Western blotting for GFP. The extent of GFP processing was not altered in the cells lacking microautophagy.
- F
Identification of stacked membranes as Golgi structures. atg5Δpep4Δ cells, in which Sec7‐GFP (a trans‐Golgi marker) and mRFP‐Sed5 (a cis‐Golgi marker) were introduced, were treated with AmphoB (2.5 μg/ml) for 9 h, and correlative fluorescence and electron microscopic images were taken. Stacked membranes were merged with Sec7‐GFP (arrows), and surrounding single membranes were merged with mRFP‐Sed5 (arrowheads). Scale bars = 0.5 μm.
- G
Generation of AP‐like structure by AmphoB. Representative AP‐like structure (double‐membrane vesicle) is shown by thin section of atg5Δpep4Δ cells treated with AmphoB. Scale bar = 0.2 μm.
- A–D
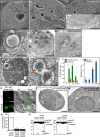
Generation of Golgi stacks by AmphoB. Stacked Golgi cisternae are observed in quick‐frozen replicas (A–C) and substituted thin section (D) of atg5Δpep4Δ cells treated with AmphoB (2.5 μg/ml) for the indicated time. (B) The magnified image shows the area indicated by the square in (A). (C, D) A representative Golgi stack with four cisternae is shown. Scale bars = 1 μm (A) and 0.5 μm (B–D).
- E–G
Generation of AP‐like double‐membrane compartment from the stacked Golgi. A quick‐frozen replica (E) and a substituted thin section (F, G) are shown. Scale bars = 0.5 μm. The distal stacks are extended, curved, and form AP‐like structure (E, F). Mitochondria are encircled by the Golgi membrane (F). (G) The AP‐like structure was separated away from Golgi stacks.
- H, I
The scene that AP‐like structure was fused with vacuole. A magnified image of (H) is shown in (I). In atg5Δpep4Δ cells treated with AmphoB (2.5 μg/ml, 24 h), outer membrane of AP‐like structure (red arrows) was fused with vacuolar membrane (blue arrows). Inner membranes of AP‐like structure (yellow arrowheads) were entered into the vacuoles to become AB‐like structure. Green arrows indicate the membrane fusion site. Scale bars = 0.5 μm (H) and 0.2 μm (I).
- J
The number of elongated single cisternae (green bars), Golgi stacks (red bars), and AB‐like structures (blue bars) was counted over time using electron microscopy images. Error bars indicate s.e.m. (3 h: n = 21, 6 h: n = 20, 12 h: n = 193, 24 h: n = 192).
- K
Translocation of the trans‐Golgi protein to the vacuolar membrane induced by AmphoB treatment. GFP‐Sft2‐expressing atg5Δ cells (trans‐Golgi marker protein) were incubated with or without AmphoB (2.5 μg/ml, 24 h), and localization of GFP‐Sft2 was assessed by confocal microscopy. Arrowhead indicates the GFP signal on the vacuolar membrane. Scale bars = 2 μm.
- L–O
Grh1 and Gvp36 involvement in AmphoB‐induced autophagy‐like proteolysis. (L, M) Representative electron microscopy images of grh1Δatg5Δpep4Δ (L) and gvp36Δatg5Δpep4Δ cells (M) treated with AmphoB (2.5 μg/ml, 24 h). AP‐like and AB‐like structures were absent. (L) A unilamellar Golgi cisterna was observed in the cytoplasm (dotted square). Scale bar = 1 μm. (M) Formation of a Golgi stack, but not Golgi curvature, was observed (dotted square). Scale bar = 0.5 μm. (N) Indicated cells were treated with AmphoB for 24 h and the number of cells containing AB‐like structures was counted by phase‐contrast microscopy. *P < 0.01 versus the value of atg5Δpep4Δ cells. (O) GFP‐pho8Δ60‐expressing atg5Δ, grh1Δatg5Δ, and gvp36Δatg5Δ cells were cultured with or without AmphoB (2.5 μg/ml, 24 h) and subjected to Western blotting for GFP. An unidentified band at 32 kDa (asterisk) is non‐specific band because it was present in Pep4‐lacking grh1Δatg5Δ cells.

- A
Localization of cellular PI(4)P. GFP‐2xPHOsh2‐expressing atg5Δ, sac1‐23/atg5Δ, and pik1‐83/atg5Δ cells were incubated with or without AmphoB (2.5 μg/ml) for 6 h at 37°C, and their localization was observed by confocal microscopy. Scale bars = 2 μm.
- B
The same experiments were performed using GFP‐GOLPH3 (a Golgi PI(4)P‐monitoring protein) instead of GFP‐2xPHOsh2. Scale bars = 2 μm.
- C, D
Reduction of AmphoB‐induced GOMED by the deletion of Golgi PI(4) phosphatases. (C) Indicated cells expressing GFP‐pho8Δ60 were cultured with or without AmphoB (2.5 μg/ml, 24 h) and subjected to Western blotting for GFP. (D) The number of AP‐like and AB‐like structures was counted using EM images (Fig EV2B and C). Error bars indicate s.e.m. (atg5Δpep4Δ cells: n = 22 and sac1‐23/atg5Δpep4Δ cells: n = 32. *P < 0.01 vs the value of atg5Δpep4Δ cells.)
- E–H
Induction of GOMED by the deletion of Golgi PI(4) kinase. (E) Indicated cells were incubated at 37°C (temperature shift) for 6 h, and cells containing AB‐like structures were counted by phase‐contrast microscopy. *P < 0.01 versus the value of atg5Δpep4Δ cells. (F) Representative electron microscopy image of pik1‐83/atg5Δpep4Δ cells at 3 h after temperature shift. AP‐like structure (arrow) and AB‐like structures were generated. Scale bar = 0.2 μm. (G) The number of AP‐like and AB‐like structures was counted using EM images. Error bars indicate s.e.m. (atg5Δpep4Δ cells at 37°C: n = 54 and pik1‐83/atg5Δpep4Δ cells at 37°C: n = 63). *P < 0.01 versus the value of atg5Δpep4Δ cells. (H) Sec7‐HA‐expressing pik1‐83/atg5Δ cells were incubated at 37°C (temperature shift) for 3 h, and freeze replica immunolabeling was performed as described in Materials and Methods. Sec7‐HA‐positive signals (labeled with 15‐nm gold particle) were observed on the surface membrane of AP‐like structure and Golgi membrane. Scale bar = 0.1 μm.
- I–L
Genetic (I, J) and pharmacological (K, L) alterations in anterograde trafficking from the Golgi are required for GOMED. (I) Indicated cells were incubated at 37°C (temperature switch) for 3 h, and the cells containing AB‐like structures were counted by phase‐contrast microscopy. *P < 0.01 versus the value of atg5Δpep4Δ cells. (J) Indicated cells were also observed using EM. Arrow indicates AP‐like structure. Scale bar = 0.5 μm. (K, L) atg5Δpep4Δ cells were treated with (CBM) or without (NT) CBM (1 mM, 3 h), and cells containing AB‐like structures were counted by phase‐contrast microscopy (K). *P < 0.01 versus the value of NT. Cells were also observed using EM (L). AB‐like structures were observed. Scale bar = 0.5 μm.
- M–O
Disturbance of anterograde trafficking from the Golgi to the PM in the cells with GOMED. Indicated cells expressing Hsp150‐HA(3×) were treated as follows: NT, no treatment; starve, starvation for 6 h; AmphoB, 2.5 μg/ml for 24 h (M); CBM, 1 mM for 24 h (N); temperature shift, from 25 to 37°C for 3 h (O). The cells were then lysed and examined for Hsp150‐HA(3×) expression by Western blotting. Accumulation of O‐glycosylated Hsp150‐HA(3×) indicated the trafficking failure from the Golgi to the PM.
- A
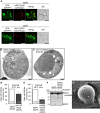
GFP‐2xPHOsh2 is partly localized at the Golgi in atg5Δ cells. The atg5Δ cells expressed GFP‐2xPHOsh2 together with mRFP‐Sed5 (a cis‐Golgi marker) or Sec7‐mRFP (a trans‐Golgi marker). The localization of each protein was observed using confocal microscopy images. GFP‐2xPHOsh2 partially merged with cis‐ and trans‐Golgi markers. Scale bars = 2 μm.
- B, C
Representative electron microscopy images of AmphoB‐treated atg5Δpep4Δ and sac1‐23/atg5Δpep4Δ cells at 37°C. “N” indicates nucleus. AB‐like structures were not observed in sac1‐23/atg5Δpep4Δ cells. Scale bars = 0.5 μm.
- D, E
Indicated cells were treated with AmphoB (2.5 μg/ml) at 37°C for 6 h (D) or at 30°C for 24 h (E), and cells containing AB‐like structures were counted by phase‐contrast microscopy. *P < 0.01 versus the value of atg5Δpep4Δ cells.
- F
GFP‐pho8Δ60‐expressing atg5Δ and inp52Δinp53Δatg5Δ cells were treated with AmphoB (2.5 μg/ml, 24 h) and subjected to Western blotting for GFP. GFP cleavage was suppressed by the lack of inp52/inp53.
- G
Sec7‐HA‐expressing pik1‐83/atg5Δ cells were incubated at 37°C (temperature shift) for 3 h, and freeze replica immunolabeling was performed. Sec7‐HA‐positive signals (labeled with 15‐nm gold particle) were observed on the surface membrane of AB‐like structure. Scale bar = 0.1 μm.
- A
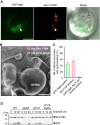
GFP‐Atg8/Sec7‐mRFP‐expressing pik1‐83 cells were incubated at 37°C (temperature shift) for 3 h, and the localization of GFP‐Atg8 and Sec7‐mRFP in the vacuoles was observed by confocal microscopy. The arrowhead and arrow indicate the Sec7‐mRFP puncta with and without GFP‐Atg8, respectively, indicating the induction of autophagy and GOMED in WT yeast cells. Scale bars = 2 μm.
- B, C
GFP‐Atg8/Sec7‐HA‐expressing pik1‐83 cells were incubated at 37°C (temperature shift) for 3 h, and freeze replica immunolabeling for HA (15 nm gold) and GFP (10 nm gold) was performed. There were two types of structures in the vacuoles: GFP‐Atg8‐positive AB and Sec7‐HA‐positive AB‐like structure, indicating the induction of GOMED in WT yeast cells. Scale bar = 1 μm. In (C), the percentage of GFP‐Atg8‐positive ABs and Sec7‐HA‐positive AB‐like structures was calculated (mean ± s.e.m., n = 6 experiments, 1,081 structures). Few structures contained both of these signals.
- D
Induction of GOMED in WT yeast cells after AmphoB treatment. Indicated GFP‐Sft2‐expressing yeast cells were treated with AmphoB (2.5 μg/ml) and subjected to Western blotting. The extent of GFP processing in atg5Δ cells and grh1Δ cells was less than that of WT cells by the lack of autophagy and GOMED, respectively. Deletion of both ATG5 and GRH1 completely abolished GFP‐Sft2 processing by the lack of autophagy and GOMED.

- A–I
Induction of GOMED in Atg5 KO MEFs by CBM treatment. (A, B) EM analysis revealed the formation of AP‐like and AL‐like structures. Atg5 KO MEFs were treated with CBM (2 mM) for 3 h. A representative low‐magnification image (A) and high‐magnification images (B) are shown. Scale bar = 1 μm (A) and 0.2 μm (B). The arrowheads and arrows indicate AL‐like and AP‐like structures, respectively. (C‐F) Involvement of Golgi membranes in the generation of AL‐like structures. (C) CLEM analysis of mCherry‐syntaxin 6‐expressing Atg5 KO MEFs. Cells were treated with CBM (2 mM) for 24 h and observed using fluorescence and electron microscopy. mCherry‐syntaxin 6 puncta merged with the AL‐like structures. Scale bar = 5 μm. “N” indicates nucleus. A magnified image of the dashed square is shown in the inset (scale bars = 2 μm). (D, E) Requirement of Grasp65 in the generation of AL‐like structures. Atg5 KO and Grasp65‐silenced Atg5 KO MEFs were treated without (NT) or with CBM (2 mM) for the indicated times followed by immunostaining with an anti‐Lamp2 antibody. Representative images (at 24 h) are shown in (D). Scale bars = 5 μm. A magnified image of the dashed square is shown in the inset (scale bars = 1 μm). CBM induced large ring‐like Lamp2 fluorescence. (E) Percentages of cells with large ring‐like Lamp2 immunofluorescence (mean ± s.e.m., n = 4). *P < 0.01 versus the value of Atg5 KO MEF. (F) Colocalization of Lamp2 and GFP‐syntaxin 6 in CBM‐treated Atg5 KO MEFs. GFP‐syntaxin 6‐expressing Atg5 KO MEFs were treated with (CBM) or without (NT) CBM (2 mM) for 6 h and immunostained with an anti‐Lamp2 antibody. The ring‐like Lamp2 fluorescence merged with the signal for syntaxin 6. Scale bar = 5 μm. A magnified image of the dashed square is shown in the inset (scale bars = 2 μm). (G) The monomeric red fluorescent protein (mRFP)‐green fluorescent protein (GFP) tandem protein assay revealed the induction of GOMED. Atg5 KO MEFs stably expressing tandem mRFP‐GFP were incubated without (no treatment) or with CBM (2 mM) for 24 h. Red signals indicate acidic compartments. Lysosomes were counterstained with an anti‐Lamp2 antibody (cyan). Scale bars = 5 μm. Regions of interest (ROI) are indicated by dashed squares; arrowheads indicate GOMED structure (scale bars = 2 μm). (H, I) Degradation of GFP‐fused proteins indicated the induction of GOMED. Atg5 KO MEFs stably expressing VSVG‐GFP (H) or M6PR‐GFP (I) were incubated with CBM (5 mM) for the indicated times. Cell lysates were subjected to immunoblotting with the anti‐GFP antibody.
- J–M
Genetic induction of GOMED in Atg5 KO MEFs. Atg5 KO MEFs were treated with the indicated small interfering (si)RNAs for 24 h, and GOMED was assessed by EM (J‐L) and the mRFP‐GFP tandem protein assay (M). Representative images are shown in (J, K). Arrows indicate AL‐like structures. Scale bars = 2 μm. (L) The number of AP‐like and AL‐like structures was calculated from the EM images of cells treated with the indicated siRNAs. Error bars indicate s.e.m. (siControl: n = 23, siPI4k2α + 3β: n = 20, siArfaptin1: n = 20). *P < 0.01 versus the value of siControl. (M) The same experiments as in (G) were performed using cells treated with the indicated siRNAs. Representative images are shown. Arrowheads indicate GOMED structure. Scale bars = 5 μm.

- A
No detection of autophagy in MIN6 cells lacking Atg5. Atg5 KO MIN6 cells were generated by the CRISPR/Cas9 system. Lack of Atg5 and LC3 modification was confirmed by immunoblot analysis using anti‐Atg5 and anti‐LC3 antibodies.
- B
An inclusion body (arrow) was observed in Atg5 KO MIN6 cells. Scale bar = 1 μm.
- C
Suppression of insulin secretion in Atg5 KO MIN6 cells after CBM treatment. Atg5 KO MIN6 cells were incubated with normal culture medium (NT) or 2 mM CBM for 24 h. The amount of secreted insulin is expressed as the percentage of that of the untreated control (NT) (mean ± s.e.m., n = 3). *P < 0.01 versus the value of NT.
- D–F
EM analysis demonstrated the induction of GOMED. Atg5 KO MIN6 cells were subjected to 2 mM CBM for 24 h. The AP‐like (white arrow), AL‐like (arrowhead) structures, and (pro)insulin granules (arrows) are shown in (D, E). Scale bars = 0.2 μm. (F) The number of AP‐like and AL‐like structures was counted using electron microscopy images. Error bars indicate s.e.m. (NT: n = 73, CBM: n = 56). *P < 0.01 versus the value of NT.
- G
Typical GOMED structures in glucose‐deprived Atg5 KO MIN6 cells. EM images of Atg5 KO MIN6 cells incubated with glucose‐depleted medium for 1 h. Magnified images of the areas indicated by the dashed squares are shown on the right side of each image. Black arrows: insulin granules, white arrows: AP‐like structures, white arrowhead: isolation membrane. Scale bars = 0.2 μm.
- H, I
EM analysis demonstrated the suppression of GOMED by the re‐addition of glucose. (H) A representative EM image of an Atg5 KO MIN6 cell shifted to glucose‐containing medium for 60 min after glucose depletion for 30 min. Scale bar = 2 μm. We did not observe AP‐like and AL‐like structures. (I) Atg5 KO MIN6 cells were cultured in glucose‐depleted medium for 30 min and shifted to normal culture medium or kept in glucose‐depleted medium for the indicated times. Cells containing GOMED structures were counted under electron microscopy. Error bars indicate s.e.m. (n = 39–256).
- J
Suppression of degradation of (pro)insulin by the re‐addition of glucose in Atg5 KO MIN6 cells. Atg5 KO MIN6 cells were cultured in glucose‐depleted medium for 1 h and shifted to glucose‐containing normal medium or kept in glucose‐depleted medium for the indicated time. Cell lysates were then subjected to immunoblot analysis using an anti‐(pro)insulin antibody.
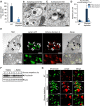
- A
Suppression of insulin secretion in Atg5 knockout (KO) MIN6 cells after glucose deprivation. Atg5 KO MIN6 cells were incubated with normal culture medium (NT) or glucose‐depleted medium for 1 h. The amount of secreted insulin is expressed as the percentage of that of the untreated control (NT) (mean ± s.e.m., n = 3). *P < 0.01 versus the value of NT.
- B, C
EM analysis revealed the induction of GOMED structures. Atg5 KO MIN6 cells were subjected to glucose deprivation for 1 h. Representative images are shown. The white arrow and black arrows indicate the AP‐like structure and insulin vesicles, respectively. Scale bars = 0.2 μm.
- D
The number of AP‐like and AL‐like structures was calculated from the EM images of cells left untreated (NT) or subjected to glucose deprivation. Error bars indicate s.e.m. (NT: n = 17, glucose deprivation: n = 84). *P < 0.01 and # P < 0.05 versus the value of NT.
- E
Involvement of Golgi membrane in the generation of GOMED. Lamp1‐GFP/mCherry‐syntaxin 6‐expressing Atg5 KO MIN6 cells were subjected to glucose deprivation and analyzed by TEM and confocal microscopy. CLEM analysis revealed that AL‐like structures (arrows) merged with Lamp1‐GFP fluorescence and syntaxin 6 fluorescence. Scale bars = 5 μm. A magnified image of the dashed square is shown in the inset (scale bars = 2 μm).
- G
GOMED‐mediated degradation of (pro)insulin by glucose deprivation of Atg5 KO MIN6 cells. Atg5 KO MIN6 cells were incubated in glucose‐depleted medium in the absence or presence of bafilomycin A1 (10 nM) for the indicated times. The cell lysates were then subjected to immunoblot analysis using an anti‐(pro)insulin antibody.
- H
Immunofluorescence analysis of (pro)insulin and Lamp2. Atg5 KO MIN6 cells were left untreated (NT) or subjected to glucose deprivation for 1 h in the presence of E64d (25 μM) or bafilomycin A1 (10 nM) and were stained with anti‐(pro)insulin and anti‐Lamp2 (lysosomal marker) antibodies and observed by fluorescence microscopy. Scale bar = 1 μm. Arrowheads indicate the colocalization of (pro)insulin with GOMED structures.

- A, B
Representative EM images of WT and Atg7 KO β‐cells. WT β‐cells were filled with insulin granules. Atg7 KO β‐cells contained an inclusion body (arrow). Scale bars = 2 μm.
- C
A representative EM image of an Atg7 KO β‐cell incubated with glucose‐depleted medium in the presence of 10 nM bafilomycin A for 1 h. We observed some AP‐like structures (white arrows). Scale bar = 2 μm.
- D–F
Representative mitophagic structures were observed in Atg7 KO β‐cells (D) and WT β‐cells (F) incubated with glucose‐depleted medium for 1 h. (E) We also observed AP‐like structures containing inclusion body. “IB” and arrow indicate inclusion body and AP‐like structure, respectively. Scale bars = 0.2 μm.

- A–D
EM analysis demonstrated the induction of GOMED. Primary Atg7 KO β‐cells were subjected to glucose deprivation for 1 h. A representative AP‐like structure containing insulin granule is shown in (A). An AL‐like structure containing insulin granules is shown in (B). Scale bars = 0.2 μm. (C, D) GOMED structures containing Golgi vesicles. An AP‐like structure containing multiple Golgi vesicles (arrows) (C) and an AL‐like structure fusing with a lysosome (arrowhead) (D) are shown. Scale bar = 0.5 μm. A magnified image of the dashed rectangle is shown in the inset (scale bar = 0.2 μm). AP‐like structure contained double membrane.
- E
The total number of AL‐like structures was calculated from the EM images of WT and Atg7 KO β‐cells after glucose deprivation. Error bars indicate s.e.m. (n = 46–163). *P < 0.01 and # P < 0.05 versus the value of 0 min.
- F
The total number of GOMED structures was calculated from the EM images of Atg7 KO β‐cells after glucose deprivation in the absence or presence of bafilomycin A1 (10 nM). Error bars indicate s.e.m. (n = 109–116). *P < 0.01 versus the value of 60 min.
- G–J
EM analysis showed the induction of mitophagy and crinophagy/SINGD. WT and Atg7 KO β‐cells were subjected to glucose deprivation for 1 h. Representative images showing mitophagy in Atg7 KO β‐cells and crinophagy/SINGD in WT β‐cells are shown in (G) and (I), respectively. Arrowhead (G) and white arrow (I) indicates mitophagy and crinophagy/SINGD, respectively. Arrows indicate insulin granules (I). Scale bars = 0.5 μm. (H, J) The number of structures representative of mitophagy (H) and crinophagy/SINGD (J) per cell was calculated from the EM images of β‐cells after glucose depletion. Error bars indicate s.e.m. (n = 46–163). *P < 0.01 and # P < 0.05 versus the value of 0 min.
- K
The number of (pro)insulin granule‐containing AL‐like structure was calculated from the EM images of wild‐type (WT) cells and Atg7 KO β‐cells after glucose deprivation. Error bars indicate s.e.m. (n = 46–163). *P < 0.01 and # P < 0.05 versus the value of 0 min.
References
-
- Abe H, Uchida T, Hara A, Mizukami H, Komiya K, Koike M, Shigihara N, Toyofuku Y, Ogihara T, Uchiyama Y, Yagihashi S, Fujitani Y, Watada H,(2013) Exendin‐4 improves β‐cell function in autophagy‐deficient β‐cells. Endocrinology 154: 4512–4524 - PubMed
-
- Arakawa‐Kobayashi S, Kobayashi T, Hasebe M, Kanaseki T (2004) Identification of crystalline material found in the thallus of the lichen, Myelochroa leucotyliza . J Struct Biol 146: 393–400 - PubMed
MeSH terms
Substances
LinkOut - more resources
Full Text Sources
Other Literature Sources
Molecular Biology Databases
Research Materials
Miscellaneous

