

Interrelationship of Primary Virus Replication, Level of Latency, and Time to Reactivation in the Trigeminal Ganglia of Latently Infected Mice
- PMID: 27512072
- PMCID: PMC5044812
- DOI: 10.1128/JVI.01373-16
Interrelationship of Primary Virus Replication, Level of Latency, and Time to Reactivation in the Trigeminal Ganglia of Latently Infected Mice
Abstract
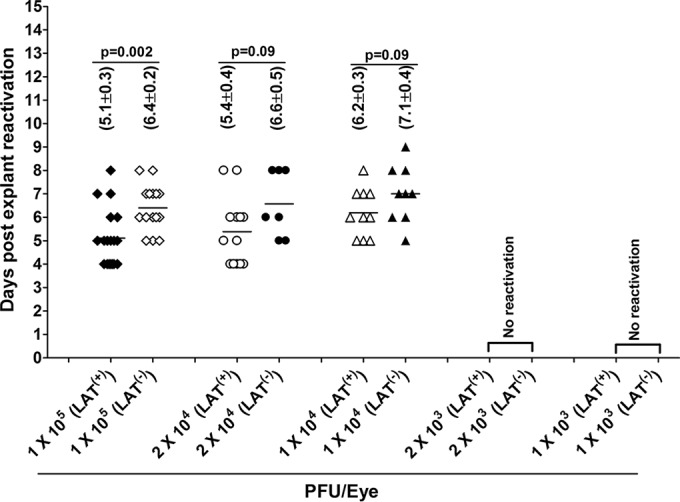
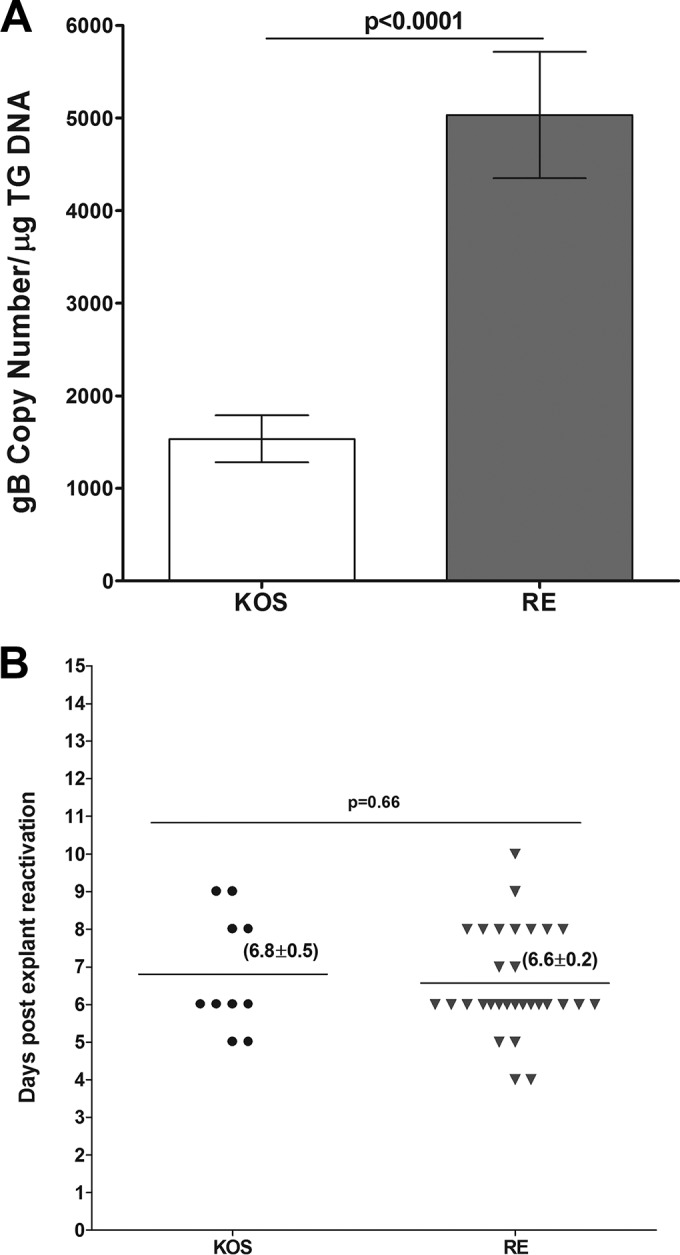
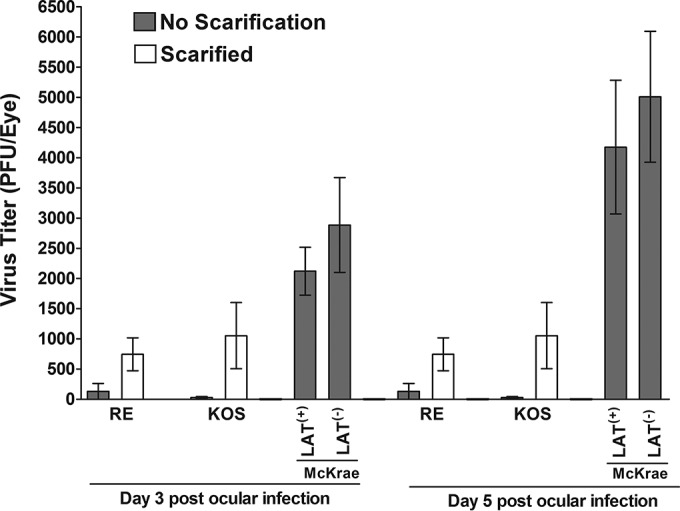
We sought to determine the possibility of an interrelationship between primary virus replication in the eye, the level of viral DNA in the trigeminal ganglia (TG) during latency, and the amount of virus reactivation following ocular herpes simplex virus type 1 (HSV-1) infection. Mice were infected with virulent (McKrae) or avirulent (KOS and RE) strains of HSV-1, and virus titers in the eyes and TG during primary infection, level of viral gB DNA in TG on day 28 postinfection (p.i.), and virus reactivation on day 28 p.i. as measured by explant reactivation were calculated. Our results suggest that the avirulent strains of HSV-1, even after corneal scarification, had lower virus titers in the eye, had less latency in the TG, and took a longer time to reactivate than virulent strains of HSV-1. The time to explant reactivation of avirulent strains of HSV-1 was similar to that of the virulent LAT((-)) McKrae-derived mutant. The viral dose with the McKrae strain of HSV-1 affected the level of viral DNA and time to explant reactivation. Overall, our results suggest that there is no absolute correlation between primary virus titer in the eye and TG and the level of viral DNA in latent TG and time to reactivation.
Importance: Very little is known regarding the interrelationship between primary virus replication in the eye, the level of latency in TG, and the time to reactivate in the mouse model. This study was designed to answer these questions. Our results point to the absence of any correlation between the level of primary virus replication and the level of viral DNA during latency, and neither was an indicator of how rapidly the virus reactivated following explant TG-induced reactivation.
Copyright © 2016, American Society for Microbiology. All Rights Reserved.
Figures
Similar articles
-
Antagonizing the Glucocorticoid Receptor Impairs Explant-Induced Reactivation in Mice Latently Infected with Herpes Simplex Virus 1.J Virol. 2019 Jun 14;93(13):e00418-19. doi: 10.1128/JVI.00418-19. Print 2019 Jul 1. J Virol. 2019. PMID: 30971470 Free PMC article.
-
CD8+ T Cells Play a Bystander Role in Mice Latently Infected with Herpes Simplex Virus 1.J Virol. 2016 Apr 29;90(10):5059-5067. doi: 10.1128/JVI.00255-16. Print 2016 May 15. J Virol. 2016. PMID: 26962220 Free PMC article.
-
An M2 Rather than a TH2 Response Contributes to Better Protection against Latency Reactivation following Ocular Infection of Naive Mice with a Recombinant Herpes Simplex Virus 1 Expressing Murine Interleukin-4.J Virol. 2018 Apr 27;92(10):e00051-18. doi: 10.1128/JVI.00051-18. Print 2018 May 15. J Virol. 2018. PMID: 29491152 Free PMC article.
-
Human alpha-herpesvirus 1 (HSV-1) viral replication and reactivation from latency are expedited by the glucocorticoid receptor.J Virol. 2025 Apr 15;99(4):e0030325. doi: 10.1128/jvi.00303-25. Epub 2025 Mar 27. J Virol. 2025. PMID: 40145740 Free PMC article. Review.
-
Local Immune Control of Latent Herpes Simplex Virus Type 1 in Ganglia of Mice and Man.Front Immunol. 2021 Sep 15;12:723809. doi: 10.3389/fimmu.2021.723809. eCollection 2021. Front Immunol. 2021. PMID: 34603296 Free PMC article. Review.
Cited by
-
Corneal pain and experimental model development.Prog Retin Eye Res. 2019 Jul;71:88-113. doi: 10.1016/j.preteyeres.2018.11.005. Epub 2018 Nov 16. Prog Retin Eye Res. 2019. PMID: 30453079 Free PMC article. Review.
-
Restoring Herpesvirus Entry Mediator (HVEM) Immune Function in HVEM-/- Mice Rescues Herpes Simplex Virus 1 Latency and Reactivation Independently of Binding to Glycoprotein D.J Virol. 2020 Jul 30;94(16):e00700-20. doi: 10.1128/JVI.00700-20. Print 2020 Jul 30. J Virol. 2020. PMID: 32522859 Free PMC article.
-
Roles of M1 and M2 Macrophages in Herpes Simplex Virus 1 Infectivity.J Virol. 2017 Jul 12;91(15):e00578-17. doi: 10.1128/JVI.00578-17. Print 2017 Aug 1. J Virol. 2017. PMID: 28490589 Free PMC article.
-
Absence of Signal Peptide Peptidase, an Essential Herpes Simplex Virus 1 Glycoprotein K Binding Partner, Reduces Virus Infectivity In Vivo.J Virol. 2019 Nov 13;93(23):e01309-19. doi: 10.1128/JVI.01309-19. Print 2019 Dec 1. J Virol. 2019. PMID: 31511378 Free PMC article.
-
Absence of signal peptide peptidase in peripheral sensory neurons affects latency-reactivation in HSV-1 ocularly infected mice.PLoS Pathog. 2022 Jan 31;18(1):e1010281. doi: 10.1371/journal.ppat.1010281. eCollection 2022 Jan. PLoS Pathog. 2022. PMID: 35100323 Free PMC article.
References
Publication types
MeSH terms
Substances
Grants and funding
LinkOut - more resources
Full Text Sources
Other Literature Sources
Medical
Molecular Biology Databases
Research Materials
Miscellaneous
