

Quantitative Non-canonical Amino Acid Tagging (QuaNCAT) Proteomics Identifies Distinct Patterns of Protein Synthesis Rapidly Induced by Hypertrophic Agents in Cardiomyocytes, Revealing New Aspects of Metabolic Remodeling
- PMID: 27512079
- PMCID: PMC5054342
- DOI: 10.1074/mcp.M115.054312
Quantitative Non-canonical Amino Acid Tagging (QuaNCAT) Proteomics Identifies Distinct Patterns of Protein Synthesis Rapidly Induced by Hypertrophic Agents in Cardiomyocytes, Revealing New Aspects of Metabolic Remodeling
Abstract
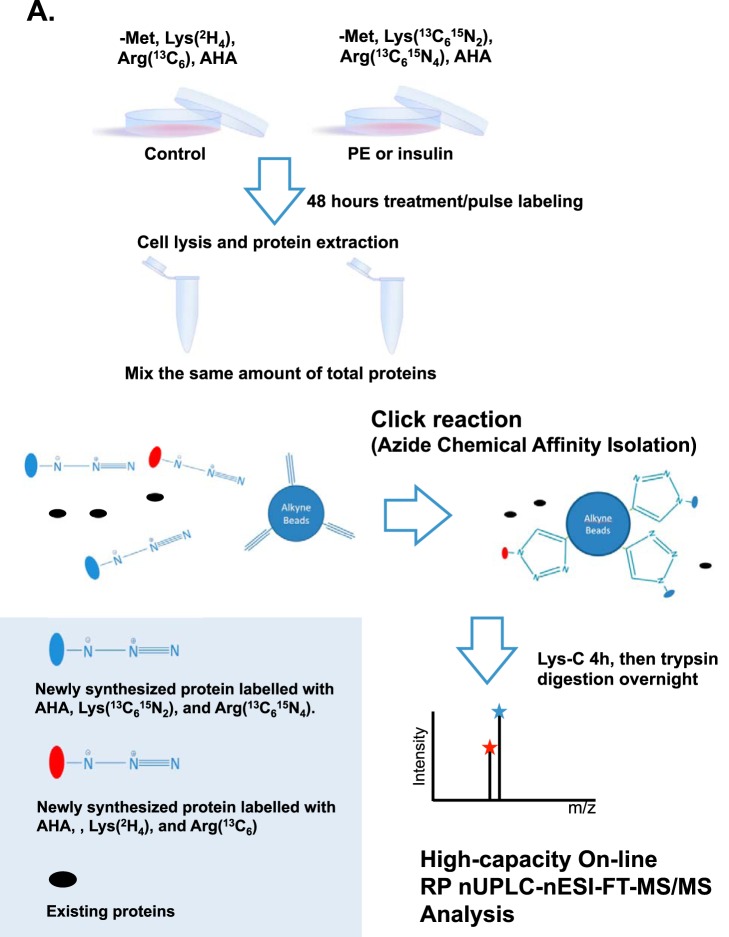
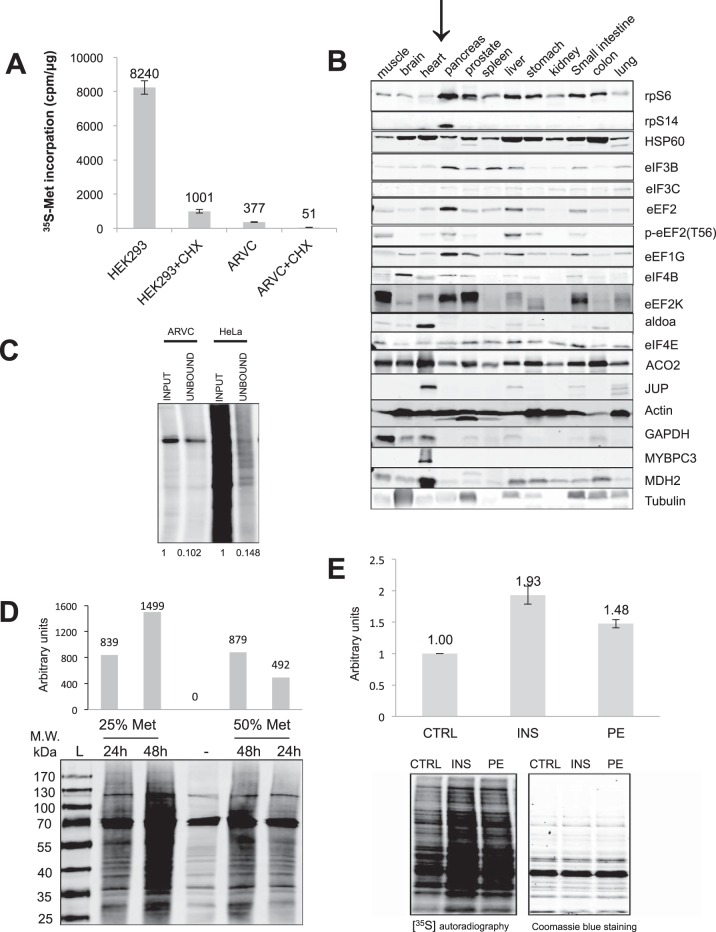
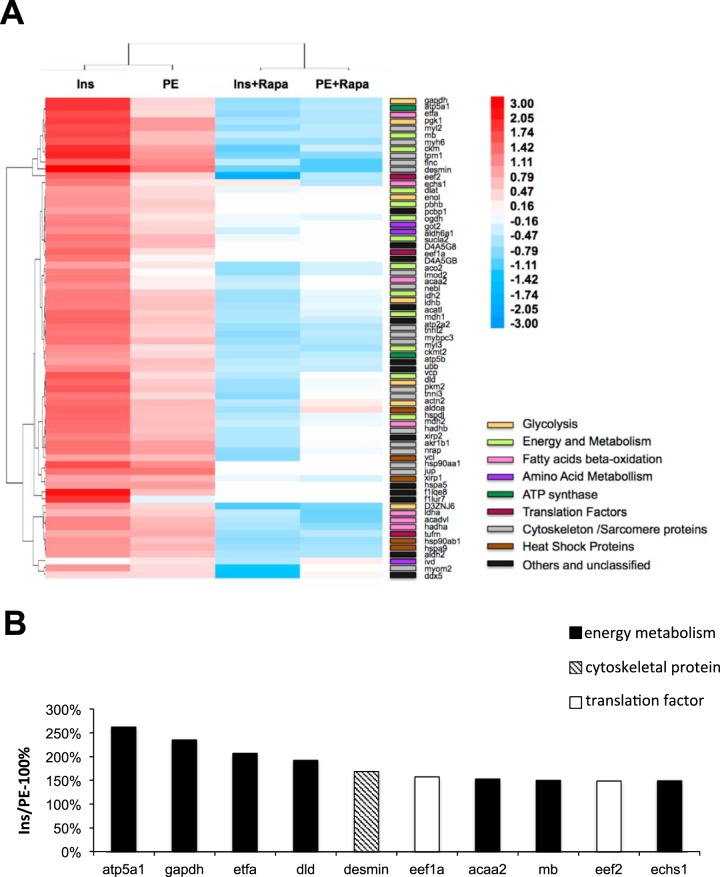
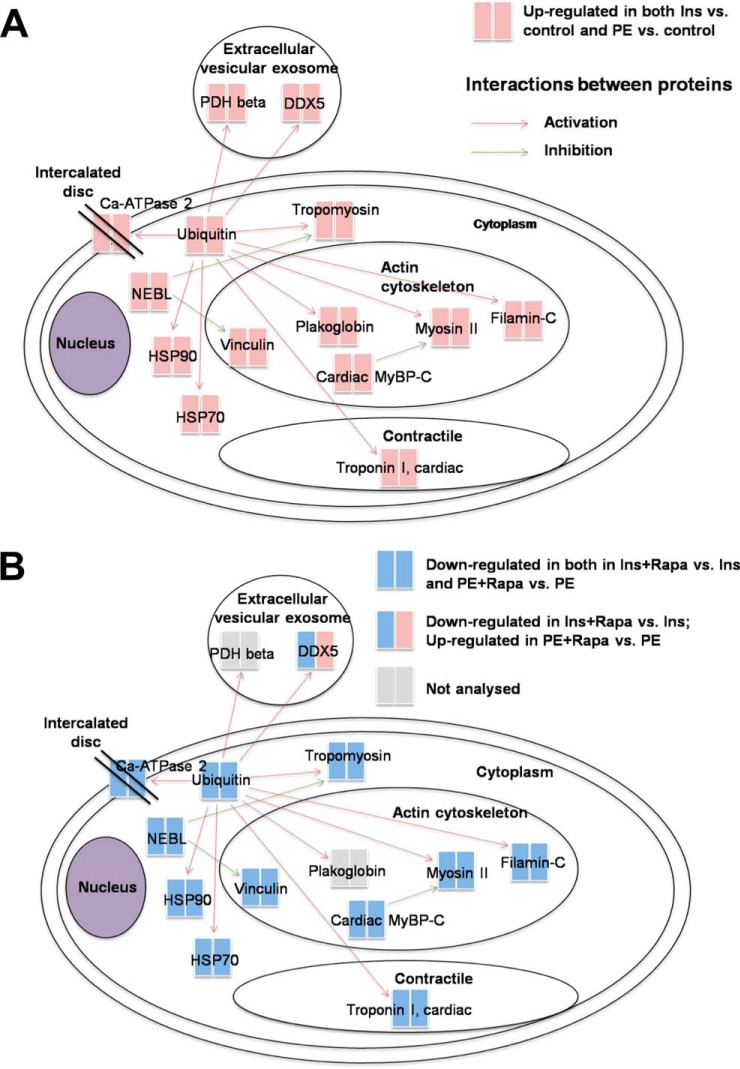
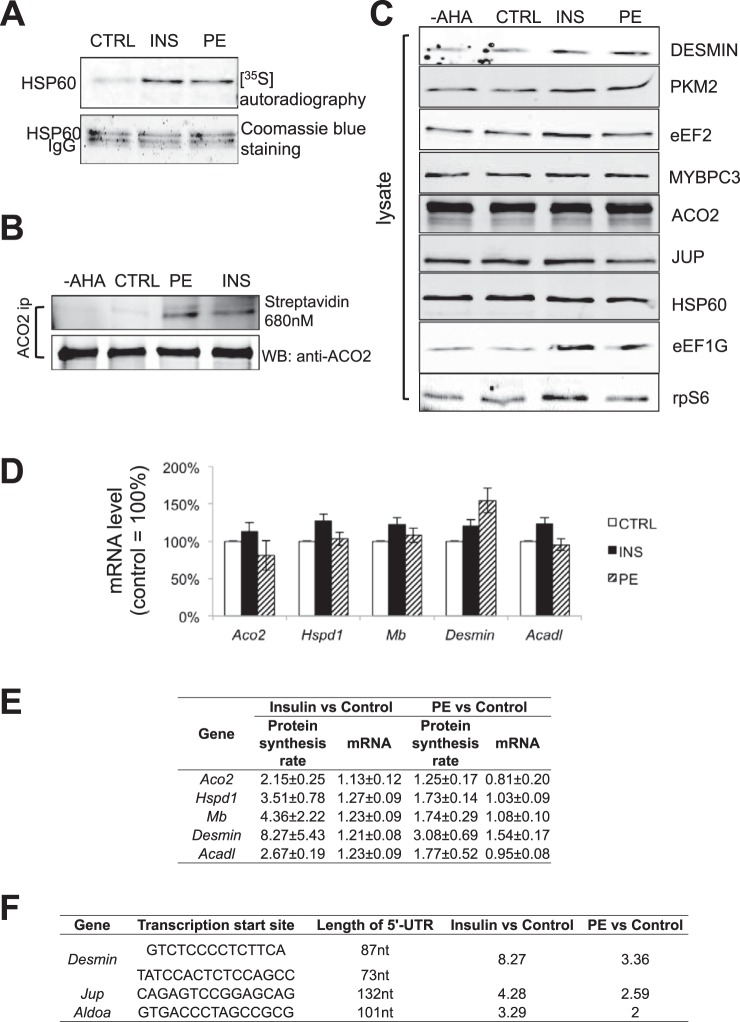
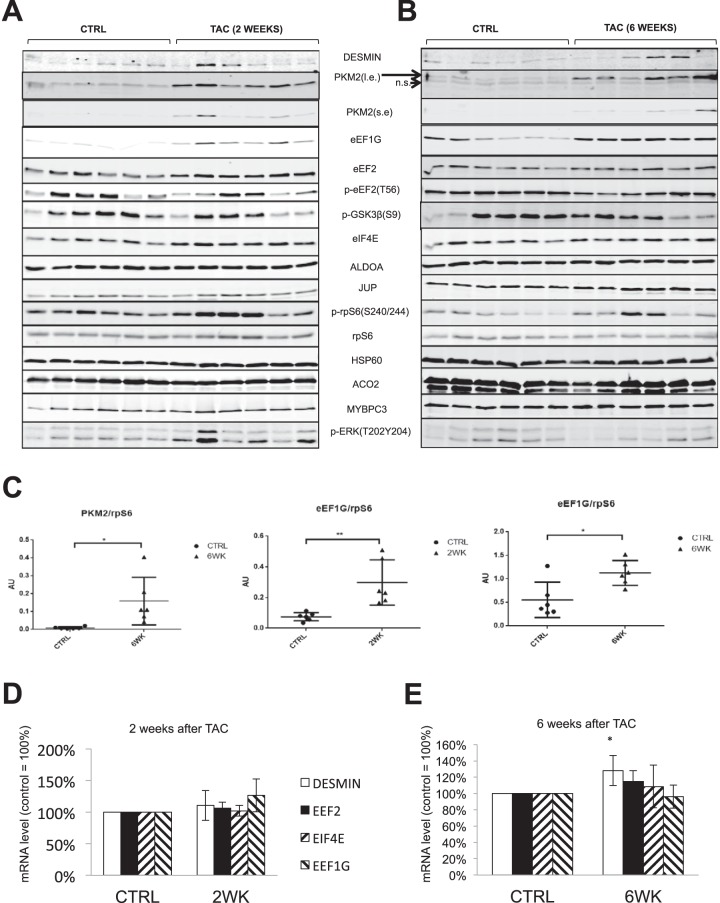
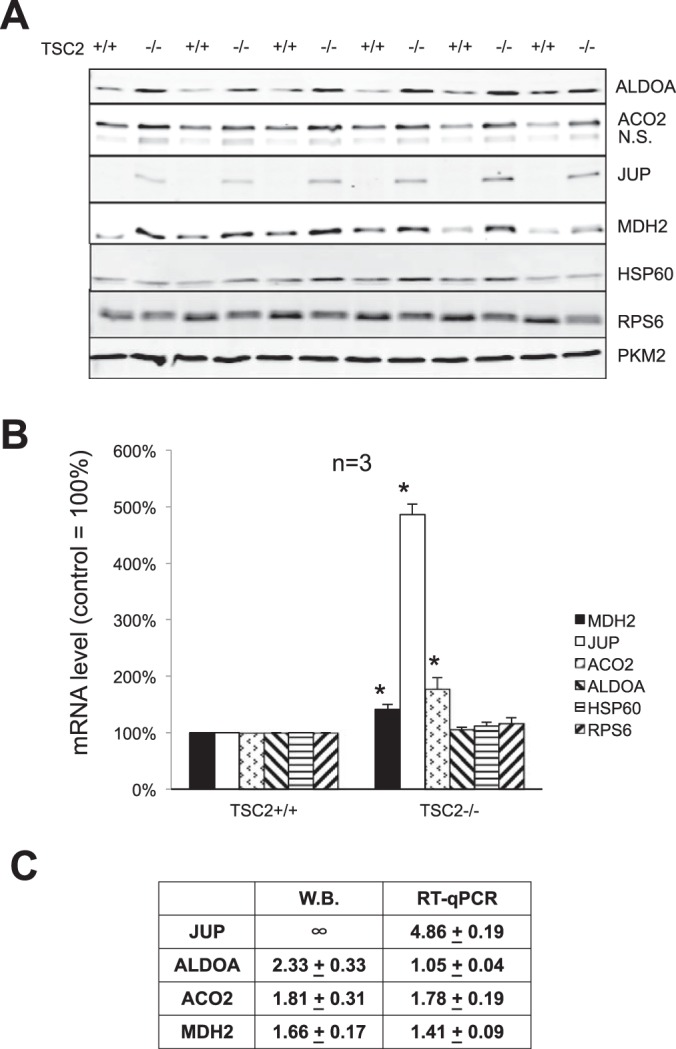
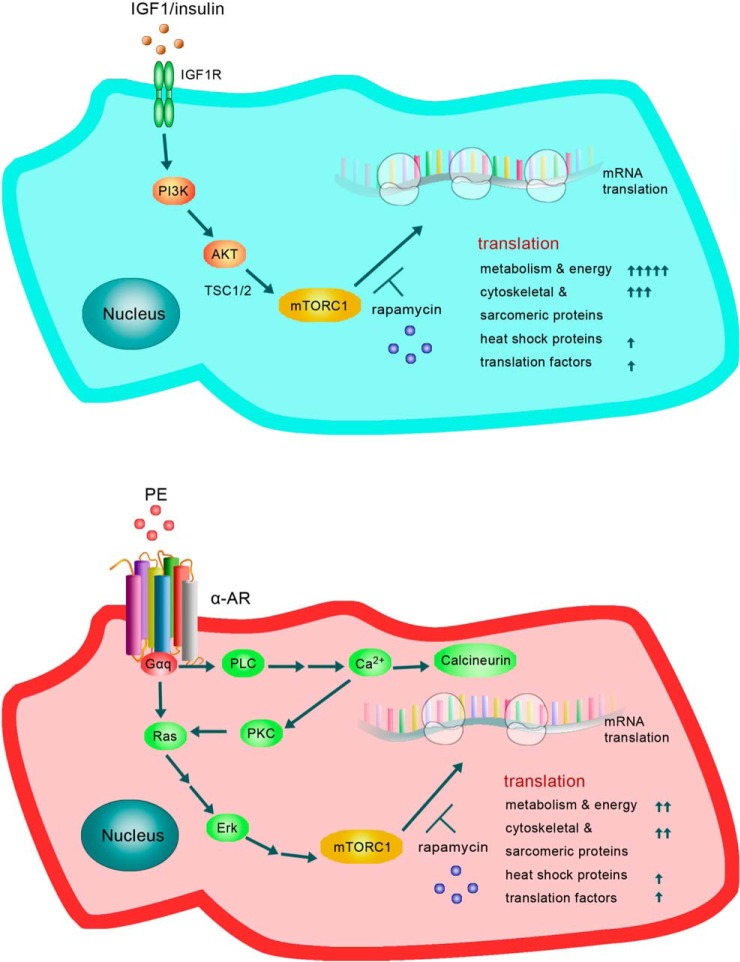
Cardiomyocytes undergo growth and remodeling in response to specific pathological or physiological conditions. In the former, myocardial growth is a risk factor for cardiac failure and faster protein synthesis is a major factor driving cardiomyocyte growth. Our goal was to quantify the rapid effects of different pro-hypertrophic stimuli on the synthesis of specific proteins in ARVC and to determine whether such effects are caused by alterations on mRNA abundance or the translation of specific mRNAs. Cardiomyocytes have very low rates of protein synthesis, posing a challenging problem in terms of studying changes in the synthesis of specific proteins, which also applies to other nondividing primary cells. To study the rates of accumulation of specific proteins in these cells, we developed an optimized version of the Quantitative Noncanonical Amino acid Tagging LC/MS proteomic method to label and selectively enrich newly synthesized proteins in these primary cells while eliminating the suppressive effects of pre-existing and highly abundant nonisotope-tagged polypeptides. Our data revealed that a classical pathologic (phenylephrine; PE) and the recently identified insulin stimulus that also contributes to the development of pathological cardiac hypertrophy (insulin), both increased the synthesis of proteins involved in, e.g. glycolysis, the Krebs cycle and beta-oxidation, and sarcomeric components. However, insulin increased synthesis of many metabolic enzymes to a greater extent than PE. Using a novel validation method, we confirmed that synthesis of selected candidates is indeed up-regulated by PE and insulin. Synthesis of all proteins studied was up-regulated by signaling through mammalian target of rapamycin complex 1 without changes in their mRNA levels, showing the key importance of translational control in the rapid effects of hypertrophic stimuli. Expression of PKM2 was up-regulated in rat hearts following TAC. This isoform possesses specific regulatory properties, so this finding indicates it may be involved in metabolic remodeling and also serve as a novel candidate biomarker. Levels of translation factor eEF1 also increased during TAC, likely contributing to faster cell mass accumulation. Interestingly those two candidates were not up-regulated in pregnancy or exercise induced CH, indicating PKM2 and eEF1 were pathological CH specific markers. We anticipate that the methodologies described here will be valuable for other researchers studying protein synthesis in primary cells.
© 2016 by The American Society for Biochemistry and Molecular Biology, Inc.
Figures
Similar articles
-
Activation of protein synthesis in cardiomyocytes by the hypertrophic agent phenylephrine requires the activation of ERK and involves phosphorylation of tuberous sclerosis complex 2 (TSC2).Biochem J. 2005 Jun 15;388(Pt 3):973-84. doi: 10.1042/BJ20041888. Biochem J. 2005. PMID: 15757502 Free PMC article.
-
Rheb activates protein synthesis and growth in adult rat ventricular cardiomyocytes.J Mol Cell Cardiol. 2008 Dec;45(6):812-20. doi: 10.1016/j.yjmcc.2008.07.016. Epub 2008 Aug 3. J Mol Cell Cardiol. 2008. PMID: 18722381
-
p90(RSK)s mediate the activation of ribosomal RNA synthesis by the hypertrophic agonist phenylephrine in adult cardiomyocytes.J Mol Cell Cardiol. 2013 Jun;59:139-47. doi: 10.1016/j.yjmcc.2013.03.006. Epub 2013 Mar 17. J Mol Cell Cardiol. 2013. PMID: 23510923
-
Blocking eukaryotic initiation factor 4F complex formation does not inhibit the mTORC1-dependent activation of protein synthesis in cardiomyocytes.Am J Physiol Heart Circ Physiol. 2009 Feb;296(2):H505-14. doi: 10.1152/ajpheart.01105.2008. Epub 2008 Dec 12. Am J Physiol Heart Circ Physiol. 2009. PMID: 19074679
-
Targeting Peroxisome Proliferator Activated Receptor α (PPAR α) for the Prevention of Mitochondrial Impairment and Hypertrophy in Cardiomyocytes.Cell Physiol Biochem. 2018;49(1):245-259. doi: 10.1159/000492875. Epub 2018 Aug 23. Cell Physiol Biochem. 2018. PMID: 30138942
Cited by
-
capCLIP: a new tool to probe translational control in human cells through capture and identification of the eIF4E-mRNA interactome.Nucleic Acids Res. 2021 Oct 11;49(18):e105. doi: 10.1093/nar/gkab604. Nucleic Acids Res. 2021. PMID: 34255842 Free PMC article.
-
Phosphorylation at Serines 157 and 161 Is Necessary for Preserving Cardiac Expression Level and Functions of Sarcomeric Z-Disc Protein Telethonin.Front Physiol. 2021 Sep 8;12:732020. doi: 10.3389/fphys.2021.732020. eCollection 2021. Front Physiol. 2021. PMID: 34566695 Free PMC article.
-
Epigenetic Reader Bromodomain Containing Protein 2 Facilitates Pathological Cardiac Hypertrophy via Regulating the Expression of Citrate Cycle Genes.Front Pharmacol. 2022 May 25;13:887991. doi: 10.3389/fphar.2022.887991. eCollection 2022. Front Pharmacol. 2022. PMID: 35694272 Free PMC article.
-
Maf1 ameliorates cardiac hypertrophy by inhibiting RNA polymerase III through ERK1/2.Theranostics. 2019 Sep 25;9(24):7268-7281. doi: 10.7150/thno.33006. eCollection 2019. Theranostics. 2019. PMID: 31695767 Free PMC article.
-
Cell-type-specific metabolic labeling of nascent proteomes in vivo.Nat Biotechnol. 2017 Dec;35(12):1196-1201. doi: 10.1038/nbt.4016. Epub 2017 Nov 6. Nat Biotechnol. 2017. PMID: 29106408
References
-
- Morgan H. E., Gordon E. E., Kira Y., Chua H. L., Russo L. A., Peterson C. J., McDermott P. J., and Watson P. A. (1987) Biochemical mechanisms of cardiac hypertrophy. Annu. Rev. Physiol. 49, 533–543 - PubMed
-
- Eghbali M., Wang Y., Toro L., and Stefani E. (2006) Heart hypertrophy during pregnancy: a better functioning heart? Trends Cardiovasc. Med. 16, 285–291 - PubMed
-
- Kim J. H., and Baggish A. L. (2016) Differentiating exercise-induced cardiac adaptations from cardiac pathology: The “Grey Zone” of clinical uncertainty. Can. J. Cardiol. 32, 429–437 - PubMed
-
- Depre C., Shipley G. L., Chen W., Han Q., Doenst T., Moore M. L., Stepkowski S., Davies P. J., and Taegtmeyer H. (1998) Unloaded heart in vivo replicates fetal gene expression of cardiac hypertrophy. Nat. Med. 4, 1269–1275 - PubMed
Publication types
MeSH terms
Substances
Grants and funding
LinkOut - more resources
Full Text Sources
Other Literature Sources
Medical
Miscellaneous
