

Continental cichlid radiations: functional diversity reveals the role of changing ecological opportunity in the Neotropics
- PMID: 27512144
- PMCID: PMC5013758
- DOI: 10.1098/rspb.2016.0556
Continental cichlid radiations: functional diversity reveals the role of changing ecological opportunity in the Neotropics
Abstract
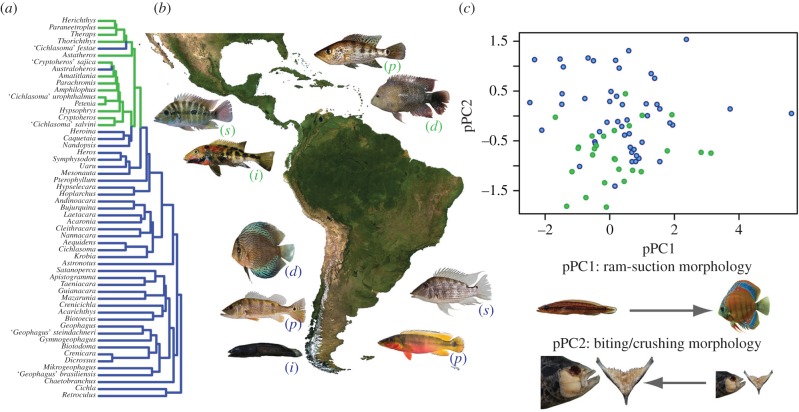
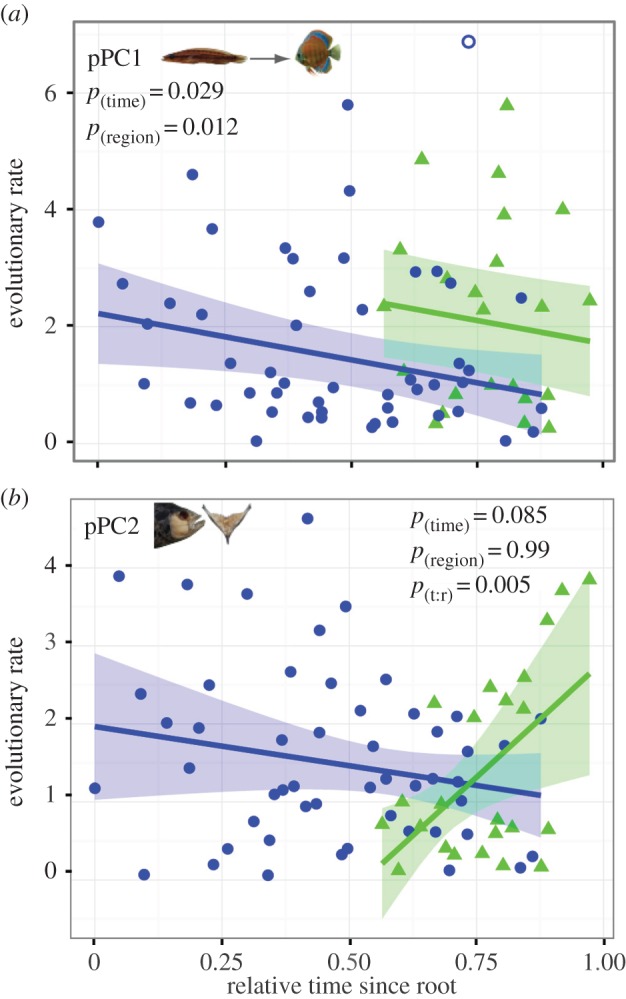
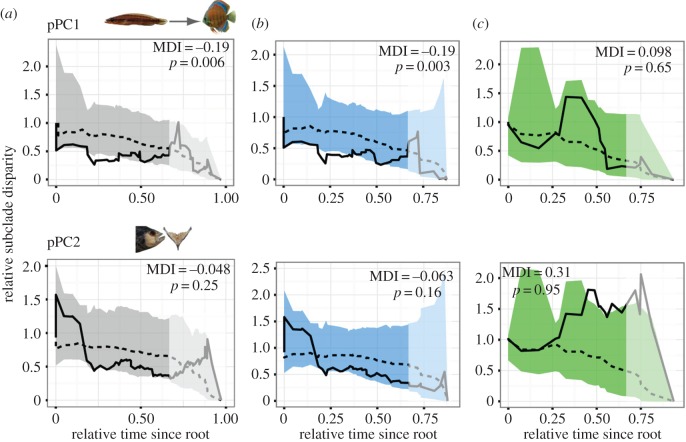
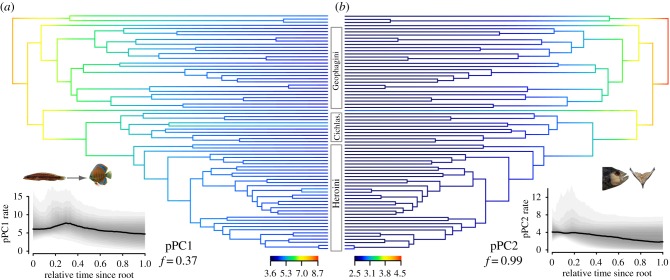
Adaptive radiations have been hypothesized to contribute broadly to the diversity of organisms. Models of adaptive radiation predict that ecological opportunity and ecological release, the availability of empty ecological niches and the response by adapting lineages to occupy them, respectively, drive patterns of phenotypic and lineage diversification. Adaptive radiations driven by 'ecological opportunity' are well established in island systems; it is less clear if ecological opportunity influences continent-wide diversification. We use Neotropical cichlid fishes to test if variation in rates of functional evolution is consistent with changing ecological opportunity. Across a functional morphological axis associated with ram-suction feeding traits, evolutionary rates declined through time as lineages diversified in South America. Evolutionary rates of ram-suction functional morphology also appear to have accelerated as cichlids colonized Central America and encountered renewed opportunity. Our results suggest that ecological opportunity may play an important role in shaping patterns of morphological diversity of even broadly distributed lineages like Neotropical cichlids.
Keywords: Cichlidae; adaptive radiation; freshwater fish; macroevolution; morphology; phylogenetics.
© 2016 The Author(s).
Figures
Similar articles
-
Adaptive landscape and functional diversity of Neotropical cichlids: implications for the ecology and evolution of Cichlinae (Cichlidae; Cichliformes).J Evol Biol. 2014 Nov;27(11):2431-42. doi: 10.1111/jeb.12486. Epub 2014 Oct 9. J Evol Biol. 2014. PMID: 25302771
-
Bentho-pelagic divergence of cichlid feeding architecture was prodigious and consistent during multiple adaptive radiations within African rift-lakes.PLoS One. 2010 Mar 8;5(3):e9551. doi: 10.1371/journal.pone.0009551. PLoS One. 2010. PMID: 20221400 Free PMC article.
-
Multilocus phylogeny and rapid radiations in Neotropical cichlid fishes (Perciformes: Cichlidae: Cichlinae).Mol Phylogenet Evol. 2010 Jun;55(3):1070-86. doi: 10.1016/j.ympev.2010.02.020. Epub 2010 Feb 21. Mol Phylogenet Evol. 2010. PMID: 20178851
-
African cichlid fish: a model system in adaptive radiation research.Proc Biol Sci. 2006 Aug 22;273(1597):1987-98. doi: 10.1098/rspb.2006.3539. Proc Biol Sci. 2006. PMID: 16846905 Free PMC article. Review.
-
Genetic Variation and Hybridization in Evolutionary Radiations of Cichlid Fishes.Annu Rev Anim Biosci. 2021 Feb 16;9:55-79. doi: 10.1146/annurev-animal-061220-023129. Epub 2020 Nov 16. Annu Rev Anim Biosci. 2021. PMID: 33197206 Review.
Cited by
-
Mitogenomic Characterization of Cameroonian Endemic Coptodon camerunensis (Cichliformes: Cichlidae) and Matrilineal Phylogeny of Old-World Cichlids.Genes (Basel). 2023 Aug 6;14(8):1591. doi: 10.3390/genes14081591. Genes (Basel). 2023. PMID: 37628642 Free PMC article.
-
Characterization and phylogenetic analysis of the complete mitochondrial genome of the firemouth cichlid, Thorichthys meeki (Perciformes: Cichlidae).Mitochondrial DNA B Resour. 2022 Jun 30;7(6):1072-1074. doi: 10.1080/23802359.2022.2086080. eCollection 2022. Mitochondrial DNA B Resour. 2022. PMID: 35783058 Free PMC article.
-
Comparing Ultraconserved Elements and Exons for Phylogenomic Analyses of Middle American Cichlids: When Data Agree to Disagree.Genome Biol Evol. 2021 Aug 3;13(8):evab161. doi: 10.1093/gbe/evab161. Genome Biol Evol. 2021. PMID: 34272856 Free PMC article.
-
The Evolutionary Dynamics of Mechanically Complex Systems.Integr Comp Biol. 2019 Sep 1;59(3):705-715. doi: 10.1093/icb/icz077. Integr Comp Biol. 2019. PMID: 31134268 Free PMC article.
-
The nature of science: The fundamental role of natural history in ecology, evolution, conservation, and education.Ecol Evol. 2023 Oct 23;13(10):e10621. doi: 10.1002/ece3.10621. eCollection 2023 Oct. Ecol Evol. 2023. PMID: 37877102 Free PMC article. Review.
References
-
- Simpson GG. 1953. The major features of evolution. New York, NY: Columbia University Press.
-
- Schluter D. 2000. Ecology of adaptive radiations. New York, NY: Oxford University Press.
-
- Glor RE. 2010. Phylogenetic insights on adaptive radiation. Annu. Rev. Ecol. Evol. Syst. 41, 251–270. (10.1146/annurev.ecolsys.39.110707.173447) - DOI
MeSH terms
Associated data
LinkOut - more resources
Full Text Sources
Other Literature Sources
