

Determination of plasma and leukocyte vitamin C concentrations in a randomized, double-blind, placebo-controlled trial with Ester-C(®)
- PMID: 27512620
- PMCID: PMC4960105
- DOI: 10.1186/s40064-016-2605-7
Determination of plasma and leukocyte vitamin C concentrations in a randomized, double-blind, placebo-controlled trial with Ester-C(®)
Abstract
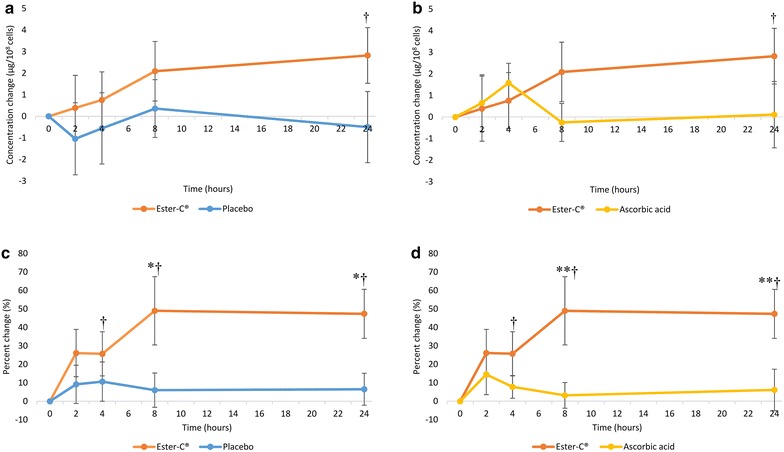
Background: Rapid uptake of vitamin C into blood and retention in tissues are important indicators of the efficacy of vitamin C supplementation and its immune-supporting role. The objective of this study was to evaluate the bioavailability of vitamin C in plasma (reflective of recent intake) and leukocytes (reflective of tissue stores and influences on immune function) from a novel vitamin C formulation, Ester-C(®).
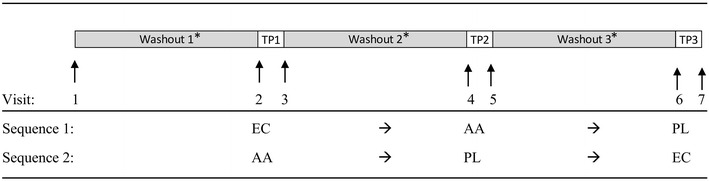
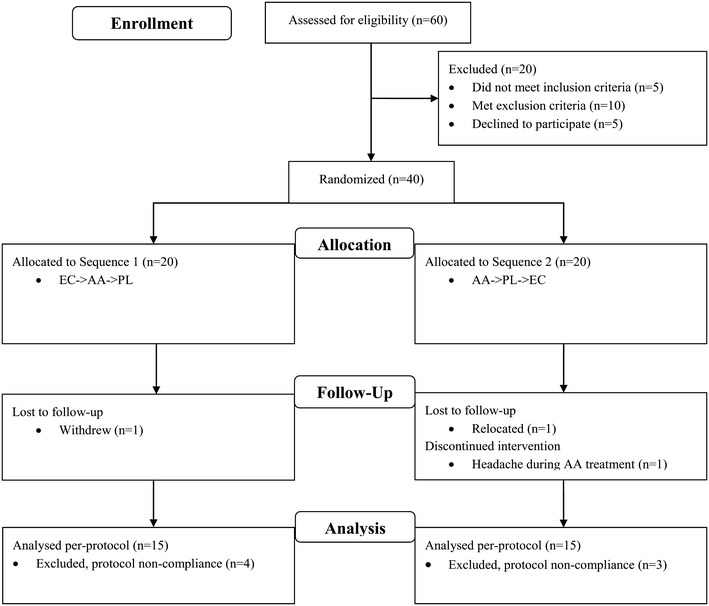
Methods: The study was a double-blind, placebo-controlled, crossover trial. Thirty-six subjects, 18-60 years of age, were randomized to receive placebo (PL, 0 mg vitamin C), ascorbic acid (AA, 1000 mg vitamin C), and Ester-C(®) (EC, 1000 mg vitamin C). Plasma and leukocyte vitamin C were measured baseline and at 2, 4, 8 and 24 h postdose.
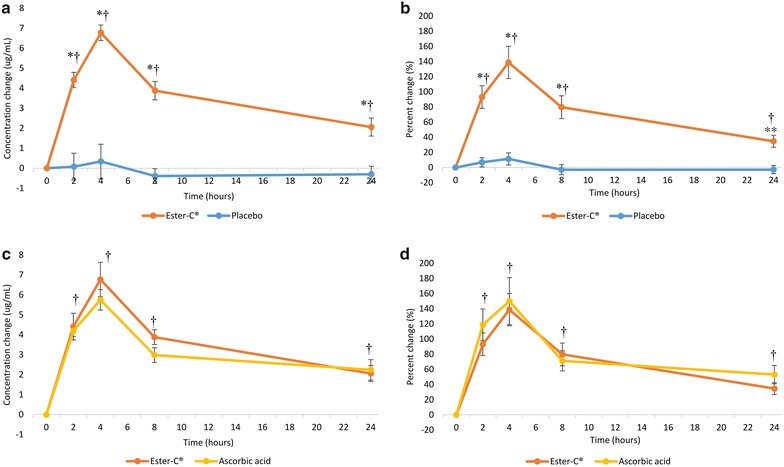
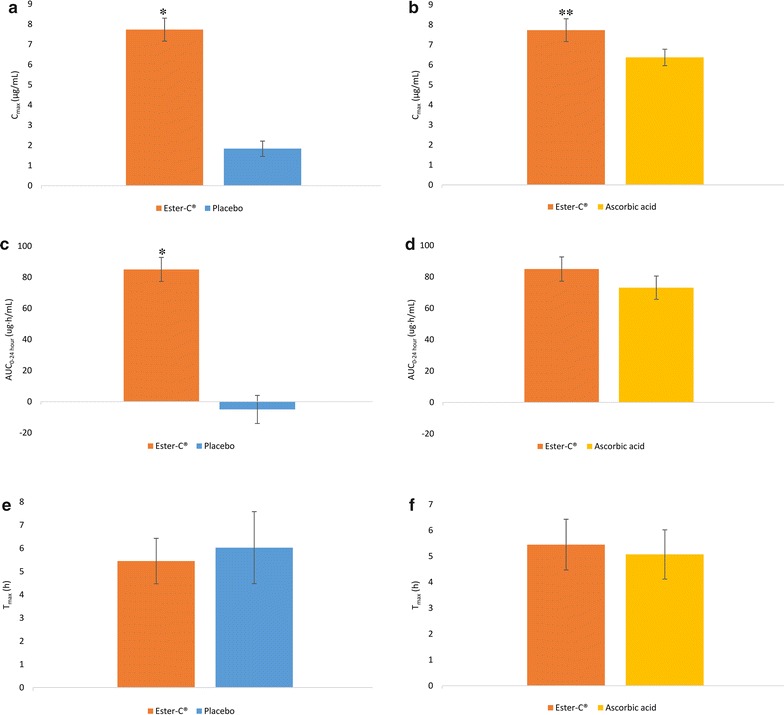
Results: The concentration and percent change from baseline in plasma were significantly higher with EC at all time points when compared to PL. No significant differences between EC and AA were observed in plasma concentration. Maximum plasma concentration was higher for EC compared to AA (P = 0.039) and PL (P < 0.001). Plasma area under the curve (AUC0-24h) was higher for EC (P < 0.001) compared to PL. The concentration change from baseline in leukocyte vitamin C was increased with EC at 24 h post-dose (P = 0.036) while no significant within-group changes were observed in AA or PL at any time point. The percent change in leukocyte vitamin C concentration was higher for EC at 8 and 24 h compared to AA (P = 0.028 and P = 0.034, respectively) and PL (P = 0.042 and P = 0.036, respectively).
Conclusions: A single dose of EC resulted in favorable percent change in leukocyte vitamin C concentration compared to AA and PL, indicating EC is retained longer within leukocytes. Trial registration ClinicalTrials.gov Identifier NCT01852903.
Keywords: Ascorbic acid/vitamin C bioavailability; Ester-C®; Leukocytes.
Figures
References
-
- Akkus I, Kalak S, Vural H, Caglayan O, Menekse E, Can G, Durmus B. Leukocyte lipid peroxidation, superoxide dismutase, glutathione peroxidase and serum and leukocyte vitamin C levels of patients with type II diabetes mellitus. Clin Chim Acta. 1996;244(2):221–227. doi: 10.1016/0009-8981(96)83566-2. - DOI - PubMed
-
- American Society of Health-System Pharmacists . AHFS drug information. Maryland: Bethesda; 1998.
-
- Anderson R, Oosthuizen R, Maritz R, Theron A, Van Rensburg AJ. The effects of increasing weekly doses of ascorbate on certain cellular and humoral immune functions in normal volunteers. Am J Clin Nutr. 1980;33(1):71–76. - PubMed
-
- Bergsten P, Amitai G, Kehrl J, Dhariwal KR, Klein HG, Levine M. Millimolar concentrations of ascorbic acid in purified human mononuclear leukocytes. Depletion and reaccumulation. J Biol Chem. 1990;265(5):2584–2587. - PubMed
-
- Biesalski HK, Köhrle J, Schümann K. Vitamine, Spurenelemente und Mineralstoffe: Prävention und Therapie mit Mikronährstoffen. Stuttgart: Thieme; 2002.
Associated data
LinkOut - more resources
Full Text Sources
Other Literature Sources
Medical
