Venous thromboembolism has the same risk factors as atherosclerosis: A PRISMA-compliant systemic review and meta-analysis
- PMID: 27512866
- PMCID: PMC4985321
- DOI: 10.1097/MD.0000000000004495
Venous thromboembolism has the same risk factors as atherosclerosis: A PRISMA-compliant systemic review and meta-analysis
Abstract
Background: Previous studies have shown that idiopathic pulmonary embolism is positively associated with other cardiovascular events, such as myocardial infarction and stroke, suggesting a potentially important association between atherosclerosis risk factors and venous thromboembolism (VTE). We performed a meta-analysis to evaluate the correlation between risk factors for atherosclerosis and VTE.
Methods: In December 2014, we searched MEDLINE and EMBASE for studies evaluating the associations between VTE and risk factors for atherosclerosis and pooled outcome data using random-effects meta-analysis. In addition, we analyzed publication bias.
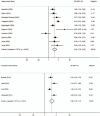
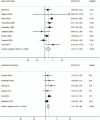
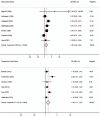
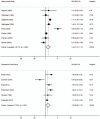
Results: Thirty-three case-control and cohort studies with a total of 185,124 patients met the inclusion criteria. We found that participants with body mass index (BMI) ≥30 kg/m had a significantly higher prevalence of VTE than those with BMI <30 kg/m in both case-control studies (odds ratio [OR] = 2.45, 95% confidence interval [CI]: 1.78-3.35) and cohort studies (relative risk [RR] = 2.39, 95% CI: 1.79-3.17). VTE was more prevalent in patients with hypertension than without hypertension (OR = 1.40, 95% CI: 1.06-1.84; RR = 1.36, 95% CI: 1.11-1.67). The findings were similar for VTE prevalence between patients with and without diabetes (OR = 1.78, 95% CI: 1.17-2.69; RR = 1.41, 95% CI: 1.20-1.66). Current smoking was significantly associated with VTE prevalence in case-control studies (OR = 1.34, 95% CI: 1.01-1.77), but not in cohort studies (RR = 1.29, 95% CI: 0.96-1.72). In addition, we found that total cholesterol and triglyceride concentrations were significantly higher in patients with VTE than without VTE (weighted mean differences [WMD] = 8.94 mg/dL, 95% CI: 3.52-14.35 mg/dL, and WMD = 14.00 mg/dL, 95% CI: 8.85-19.16 mg/dL, respectively). High-density lipoprotein cholesterol concentrations were significantly lower in patients with VTE than without VTE (WMD = -2.03 mg/dL, 95% CI: -3.42 to -0.63 mg/dL). Higher quality studies were more homogeneous, but confirmed the same significant associations.
Conclusions: Based on our systematic review and meta-analysis, we observed a significant association between VTE and the risk factors for atherosclerosis. These results may make an important contribution to clinical practice regarding VTE treatment.
Conflict of interest statement
Disclosure: The authors have no conflicts of interest to disclose.
Figures


Similar articles
-
Sertindole for schizophrenia.Cochrane Database Syst Rev. 2005 Jul 20;2005(3):CD001715. doi: 10.1002/14651858.CD001715.pub2. Cochrane Database Syst Rev. 2005. PMID: 16034864 Free PMC article.
-
Systemic pharmacological treatments for chronic plaque psoriasis: a network meta-analysis.Cochrane Database Syst Rev. 2017 Dec 22;12(12):CD011535. doi: 10.1002/14651858.CD011535.pub2. Cochrane Database Syst Rev. 2017. Update in: Cochrane Database Syst Rev. 2020 Jan 9;1:CD011535. doi: 10.1002/14651858.CD011535.pub3. PMID: 29271481 Free PMC article. Updated.
-
Interventions for implementation of thromboprophylaxis in hospitalized patients at risk for venous thromboembolism.Cochrane Database Syst Rev. 2018 Apr 24;4(4):CD008201. doi: 10.1002/14651858.CD008201.pub3. Cochrane Database Syst Rev. 2018. PMID: 29687454 Free PMC article.
-
Body weight and metabolic adverse effects of asenapine, iloperidone, lurasidone and paliperidone in the treatment of schizophrenia and bipolar disorder: a systematic review and exploratory meta-analysis.CNS Drugs. 2012 Sep 1;26(9):733-59. doi: 10.2165/11634500-000000000-00000. CNS Drugs. 2012. PMID: 22900950
-
Systemic pharmacological treatments for chronic plaque psoriasis: a network meta-analysis.Cochrane Database Syst Rev. 2021 Apr 19;4(4):CD011535. doi: 10.1002/14651858.CD011535.pub4. Cochrane Database Syst Rev. 2021. Update in: Cochrane Database Syst Rev. 2022 May 23;5:CD011535. doi: 10.1002/14651858.CD011535.pub5. PMID: 33871055 Free PMC article. Updated.
Cited by
-
Evaluation of the impact of body mass index on venous thromboembolism risk factors.PLoS One. 2020 Jul 9;15(7):e0235007. doi: 10.1371/journal.pone.0235007. eCollection 2020. PLoS One. 2020. PMID: 32645000 Free PMC article.
-
Antithrombotic therapy in diabetes: which, when, and for how long?Eur Heart J. 2021 Jun 14;42(23):2235-2259. doi: 10.1093/eurheartj/ehab128. Eur Heart J. 2021. PMID: 33764414 Free PMC article. Review.
-
Assessment of hypertension and other factors associated with the severity of disease in COVID-19 pneumonia, Addis Ababa, Ethiopia: A case-control study.PLoS One. 2022 Aug 15;17(8):e0273012. doi: 10.1371/journal.pone.0273012. eCollection 2022. PLoS One. 2022. PMID: 35969590 Free PMC article.
-
Life's Essential 8 is associated with atherosclerotic cardiovascular disease but not venous thromboembolism in men: a prospective cohort study.Ann Med. 2023 Dec;55(1):2233894. doi: 10.1080/07853890.2023.2233894. Ann Med. 2023. PMID: 37459575 Free PMC article.
-
A systematic review of risk prediction model of venous thromboembolism for patients with lung cancer.Thorac Cancer. 2024 Feb;15(4):277-285. doi: 10.1111/1759-7714.15219. Epub 2024 Jan 17. Thorac Cancer. 2024. PMID: 38233997 Free PMC article.
References
-
- Horlander KT, Mannino DM, Leeper KV. Pulmonary embolism mortality in the United States, 1979–1998: an analysis using multiple-cause mortality data. Arch Intern Med 2003; 163:1711–1717. - PubMed
-
- Goldhaber SZ, Elliott CG. Acute pulmonary embolism: part I: epidemiology, pathophysiology, and diagnosis. Circulation 2003; 108:2726–2729. - PubMed
-
- Brotman DJ, Deitcher SR, Lip GY, et al. Virchow's triad revisited. South Med J 2004; 97:213–214. - PubMed
-
- Becattini C, Agnelli G, Prandoni P, et al. A prospective study on cardiovascular events after acute pulmonary embolism. Eur Heart J 2005; 26:77–83. - PubMed
Publication types
MeSH terms
Substances
LinkOut - more resources
Full Text Sources
Other Literature Sources
Medical
Miscellaneous

