. 2016 Nov;240(3):315-328.
doi: 10.1002/path.4778.

Three-dimensional modelling identifies novel genetic dependencies associated with breast cancer progression in the isogenic MCF10 model

Affiliations

Three-dimensional modelling identifies novel genetic dependencies associated with breast cancer progression in the isogenic MCF10 model

Sarah L Maguire et al. J Pathol. 2016 Nov.

Abstract

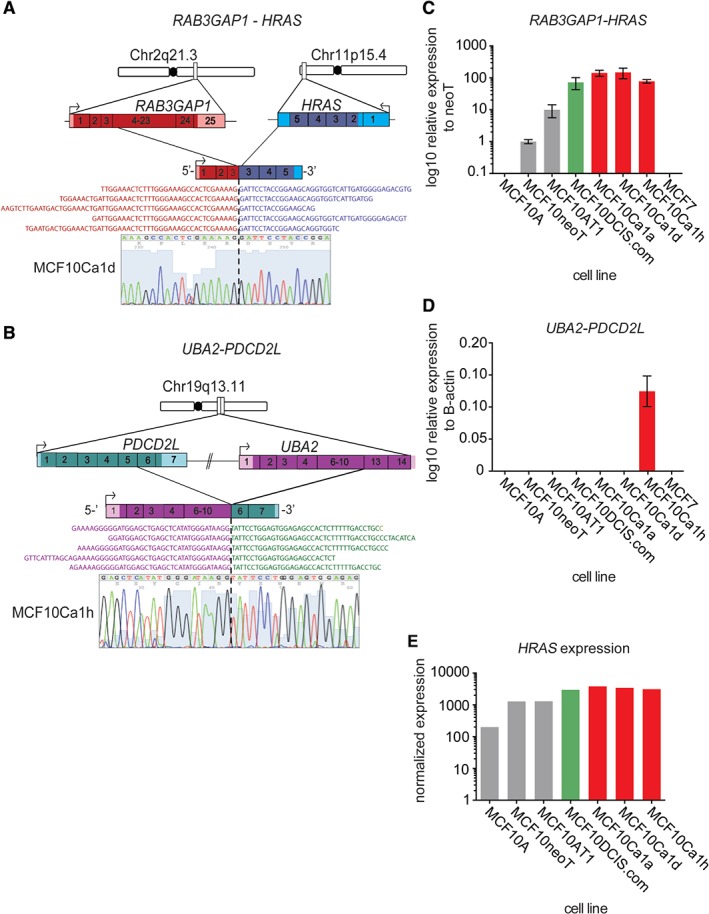
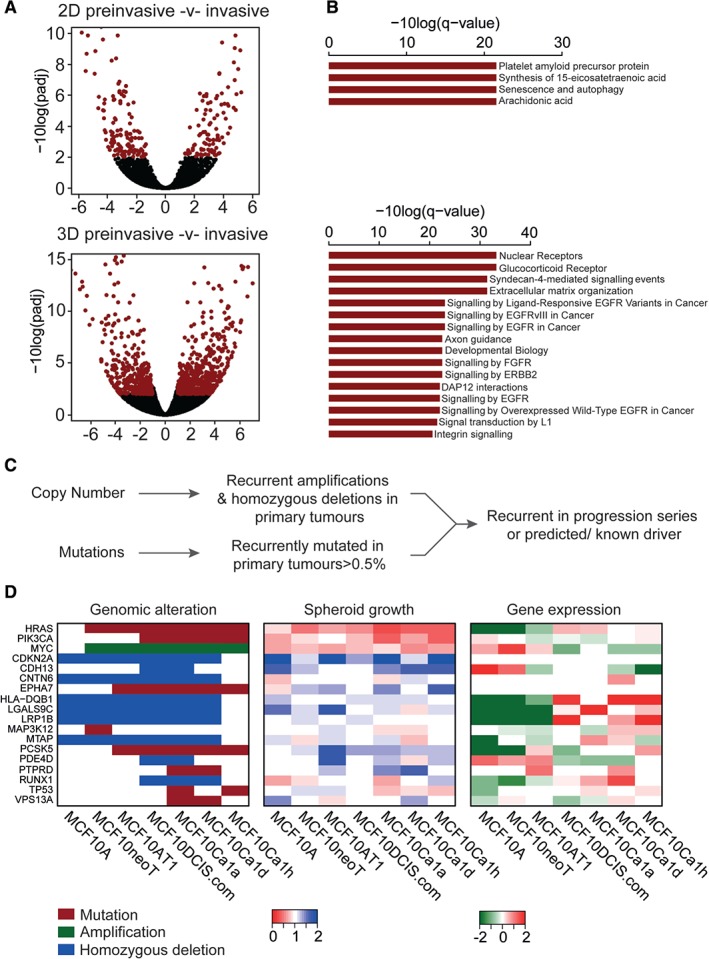
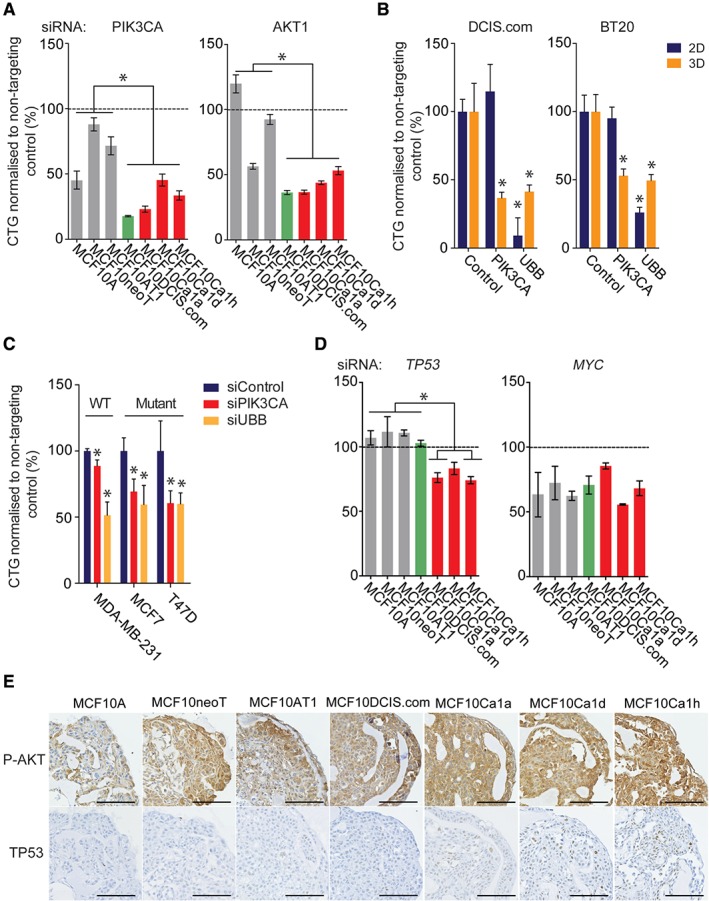
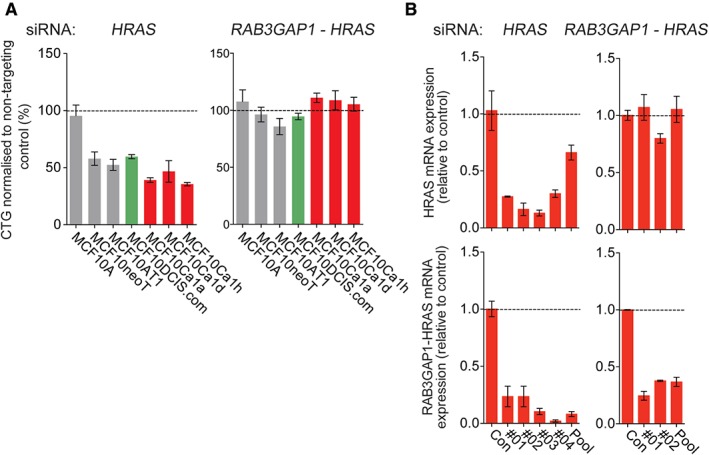
The initiation and progression of breast cancer from the transformation of the normal epithelium to ductal carcinoma in situ (DCIS) and invasive disease is a complex process involving the acquisition of genetic alterations and changes in gene expression, alongside microenvironmental and recognized histological alterations. Here, we sought to comprehensively characterise the genomic and transcriptomic features of the MCF10 isogenic model of breast cancer progression, and to functionally validate potential driver alterations in three-dimensional (3D) spheroids that may provide insights into breast cancer progression, and identify targetable alterations in conditions more similar to those encountered in vivo. We performed whole genome, exome and RNA sequencing of the MCF10 progression series to catalogue the copy number and mutational and transcriptomic landscapes associated with progression. We identified a number of predicted driver mutations (including PIK3CA and TP53) that were acquired during transformation of non-malignant MCF10A cells to their malignant counterparts that are also present in analysed primary breast cancers from The Cancer Genome Atlas (TCGA). Acquisition of genomic alterations identified MYC amplification and previously undescribed RAB3GAP1-HRAS and UBA2-PDCD2L expressed in-frame fusion genes in malignant cells. Comparison of pathway aberrations associated with progression showed that, when cells are grown as 3D spheroids, they show perturbations of cancer-relevant pathways. Functional interrogation of the dependency on predicted driver events identified alterations in HRAS, PIK3CA and TP53 that selectively decreased cell growth and were associated with progression from preinvasive to invasive disease only when cells were grown as spheroids. Our results have identified changes in the genomic repertoire in cell lines representative of the stages of breast cancer progression, and demonstrate that genetic dependencies can be uncovered when cells are grown in conditions more like those in vivo. The MCF10 progression series therefore represents a good model with which to dissect potential biomarkers and to evaluate therapeutic targets involved in the progression of breast cancer. © 2016 The Authors. The Journal of Pathology published by John Wiley & Sons Ltd on behalf of Pathological Society of Great Britain and Ireland.

Keywords: 3D spheroid assays; breast cancer progression; next-generation sequencing.


Figures

Figure 1
Figure 1
Spectrum of acquired alterations in the MCF10 progression series. (A) Diagrammatic representation of the generation of the MCF10 progression series. Non‐invasive cell lines are highlighted in grey, DCIS.com cell are highlighted in green, and invasive cell lines are highlighted in red. Circled numbers represent the number of days for which cell lines were grown in vivo before replantation. (B) Matrix of identified somatic mutations acquired from MCF10A cells that also occur in TCGA breast cancer data. Mutations were classified according to membership of Cancer Gene Census (navy blue) 79, the results of the gene driver prediction algorithm FATHMM (purple) 61 and other prediction algorithms (grey) are shown (see Materials and methods). (C) Heatmap of gains (red) and losses (blue) identified from GISTIC. The genomic position is plotted along the x‐axis, and samples are plotted on the y‐axis. A heatmap of focal (<10 Mb) amplifications and homozygous deletions identified from GISTIC is shown. The colour scale bar depicts homozygous deletions to amplifications (–2 to +2). Note the presence of focal amplification of MYC (8q24.21) acquired from MCF10neoT cells onwards. (D) Chromosome 8 plots of MCF10A, MCF10neoT and MCF10Ca1a cells of log2‐normalized sequencing reads (y‐axis) plotted against base pair position cross chromosome 8. Green represents an amplification log2 ratio of >1.8. (E) Unrooted phylogenetic tree generated by neighbour joining of the MCF10 progression series based on variant data and whole arm chromosomal changes acquired from MCF10A cells onwards. Driver mutations and chromosomal changes acquired are indicated in grey.
Figure 2
Figure 2
Identification of expressed fusion genes in the MCF10 progression series. (A) Cartoon representation of genomic location, orientation and architecture of the expressed RAB3GAP1–HRAS fusion gene. Representative RNA sequencing reads spanning the fusion are also displayed. The RT‐qPCR product was Sanger‐sequenced; confirming the fusion junction, and a representative chromatogram from MCF10Ca1d cells is shown. (B) Cartoon representation of genomic location, orientation and architecture of the expressed UBA2–PDCD2L fusion gene. Representative RNA sequencing reads spanning the fusion are also displayed. The RT‐qPCR product was Sanger‐sequenced, confirming the fusion junction, and a representative chromatogram from MCF10Ca1h cells is shown. (C) Bar plot showing relative expression of the RAB3GAP1–HRAS fusion gene in the MCF10 progression series detected by RT‐qPCR. (D) Bar plot showing relative expression of the UBA2–PDCD2L fusion gene in the MCF10 progression series detected by RT‐qPCR (E) Bar plot of normalized reads of HRAS in the MCF10 progression series from RNA sequencing.
Figure 3
Figure 3
Evaluation of pathways and driver alterations in spheroid cultures. (A) Volcano plots showing the differentially expressed transcripts between preinvasive and invasive cells from the MCF10 progression series cultured under both 2D and 3D conditions. Red: FDR p‐values of <0.01. (B) Bar plot showing the significantly over‐represented pathways (ConsensusDb q‐value of <0.01) from (A). (C) Schematic of gene selection for the siRNA screen. (D) Matched heatmaps of genomic status (mutation, amplification, and homozygous deletion); results of spheroid growth after siRNA‐mediated silencing and gene expression. Relative spheroid growth was measured according to the survival fraction of treated cells relative to siControl. Hits were triaged as a relative survival fraction as compared with non‐targeting control of <0.8 or >1.2. Gene expression is the log2 median centred normalized reads from the RNA sequencing data.
Figure 4
Figure 4
Functional validation of dependency on driver events in the MCF10 progression series. (A) Progression series cell lines were reverse‐transfected with siRNAs against PIK3CA and AKT1, and with a non‐targeting control. Spheroids were formed after 24 h in low‐attachment plates, and the medium was topped up every 3 days. After 7 days, spheroid viability was determined with Cell Titre Glo. (B) DCIS.com and BT20 cell lines were reverse‐transfected with siRNAs targeting PIK3CA and UBB, and with a non‐targeting control, under both 2D and 3D conditions. The medium was topped up every 3 days. Viability was determined with Cell Titre Glo. Statistical comparisons were performed with Student's t‐test (*p ≤ 0.05). (C) MDA‐MB‐231, MCF7 and T47D cell lines were reverse‐transfected with siRNAs targeting PIK3CA and UBB, and with a non‐targeting control, under 3D conditions. The medium was topped up every 3 days, and spheroid viability was determined with Cell Titre Glo. Statistical comparisons were performed with Student's t‐test (*p ≤ 0.05). (D) Progression series cell lines were reverse‐transfected with siRNAs against TP53 and MYC, and with a non‐targeting control. Spheroids were formed after 24 h in low‐attachment plates, and the medium was topped up every 3 days. After 7 days, spheroid viability was determined with Cell Titre Glo. (E) The progression series was grown for 7 days. The medium was topped up every 3 days. After 7 days, spheroids were fixed with formaldehyde, embedded, sectioned, and stained for phospho‐AKT (P‐AKT) (473) and total TP53. Representative images are shown. Scale bar: 100 µm.
Figure 5
Figure 5
Functional validation of dependency on TP53 and HRAS in the MCF10 progression series. (A) Progression series cell lines were reverse‐transfected with siRNAs against HRAS and RAB3GAP1–HRAS, and with a non‐targeting control. Spheroids were formed after 24 h in low‐attachment plates, and the medium was topped up every 3 days. Spheroid viability was determined with Cell Titer Glo. (B) MCF10Ca1a cells were reverse‐transfected with single and pooled siRNAs targeting HRAS and RAB3GAP1–HRAS, and with a non‐targeting control, for 72 h. HRAS expression and RAB3GAP1–HRAS expression were determined with RT‐qPCR. Expression was normalized to loading controls B2M and β‐actin (ACTB).

References

    1. Cowell CF, Weigelt B, Sakr RA, et al. Progression from ductal carcinoma in situ to invasive breast cancer: revisited. Mol Oncol 2013; 7 : 859–869. - PMC - PubMed
    1. Lopez‐Garcia MA, Geyer FC, Lacroix‐Triki M, et al. Breast cancer precursors revisited: molecular features and progression pathways. Histopathology 2010; 57 : 171–192. - PubMed
    1. Ma XJ, Dahiya S, Richardson E, et al. Gene expression profiling of the tumor microenvironment during breast cancer progression. Breast Cancer Res 2009; 11 : R7. - PMC - PubMed
    1. Simpson PT, Reis‐Filho JS, Gale T, et al. Molecular evolution of breast cancer. J Pathol 2005; 205 : 248–254. - PubMed
    1. Vargas AC, McCart Reed AE, Waddell N, et al. Gene expression profiling of tumour epithelial and stromal compartments during breast cancer progression. Breast Cancer Res Treat 2012; 135 : 153–165. - PubMed

Publication types

MeSH terms

Substances