. 2016 Aug 11;11(8):e0161163.
doi: 10.1371/journal.pone.0161163. eCollection 2016.

Keratin 17 Is Induced in Oral Cancer and Facilitates Tumor Growth

Affiliations

Keratin 17 Is Induced in Oral Cancer and Facilitates Tumor Growth

Rumana Khanom et al. PLoS One. .

Abstract

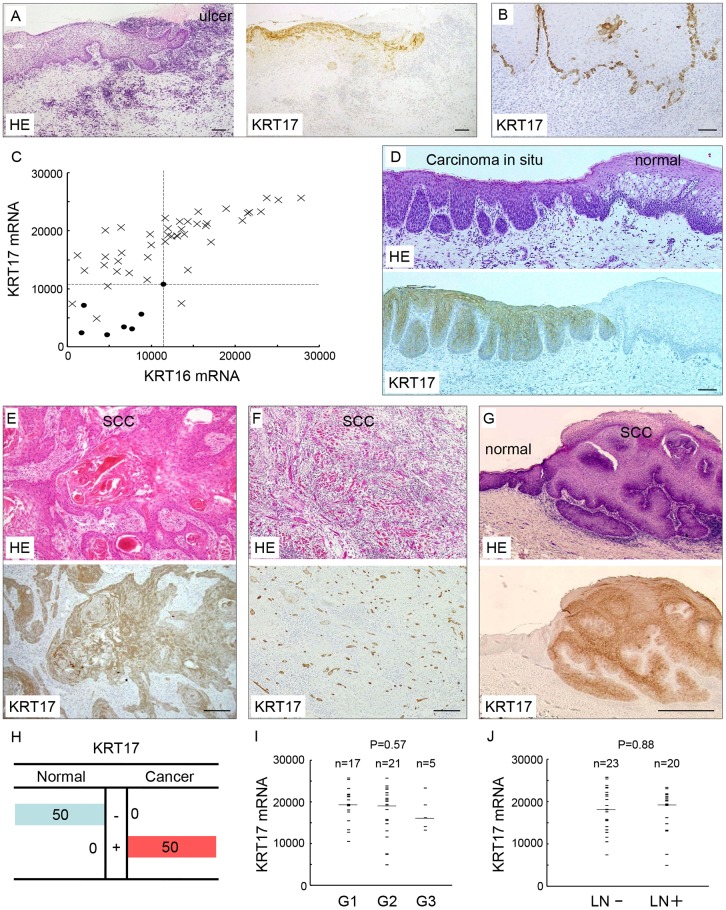
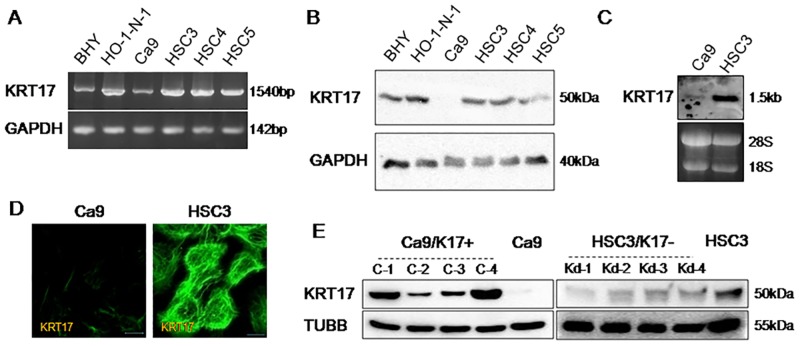
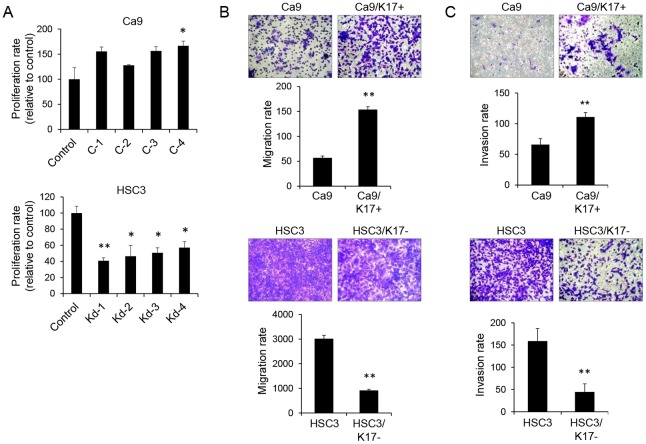
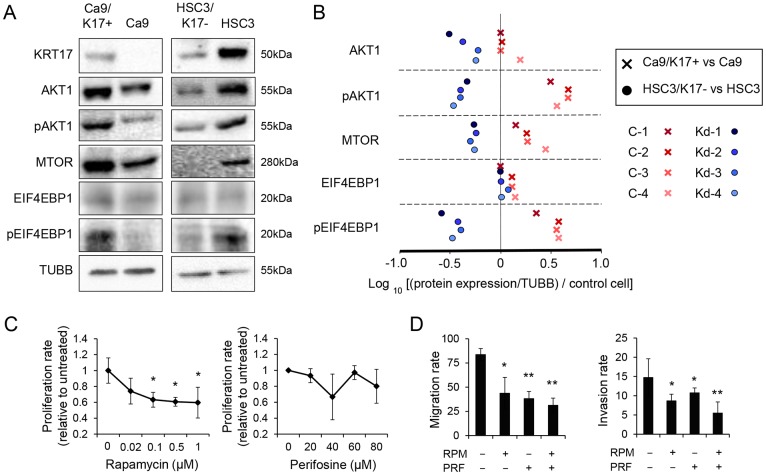
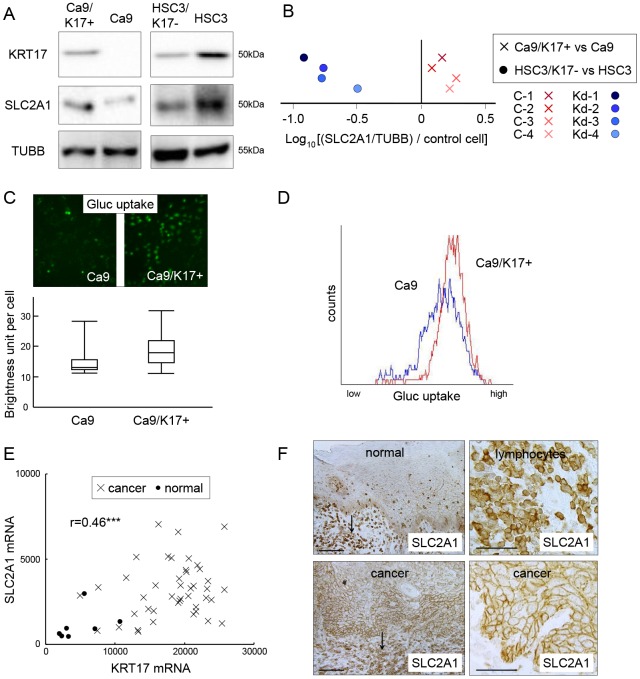
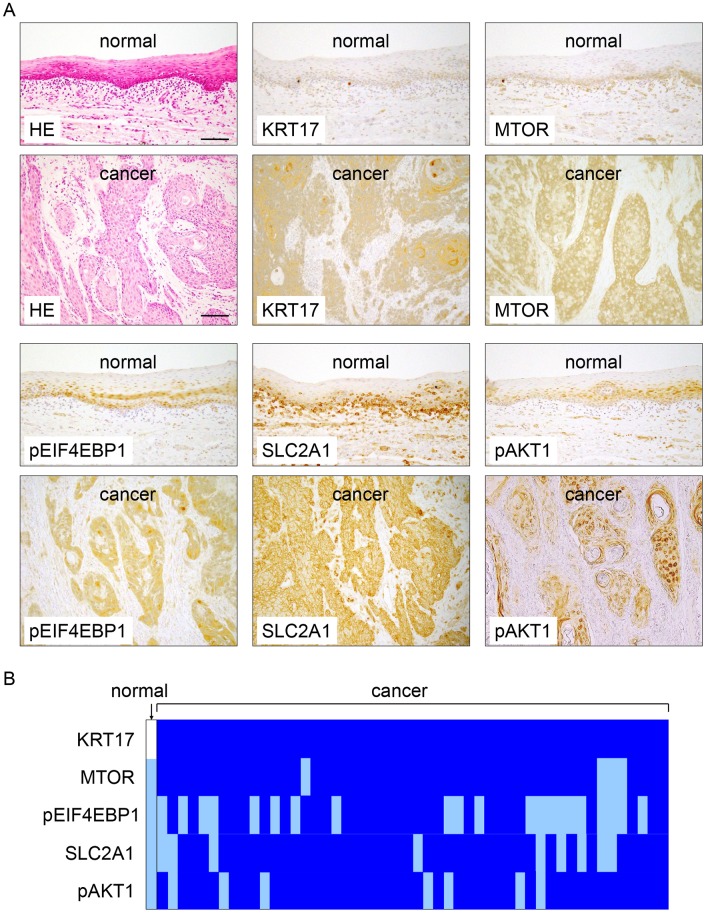
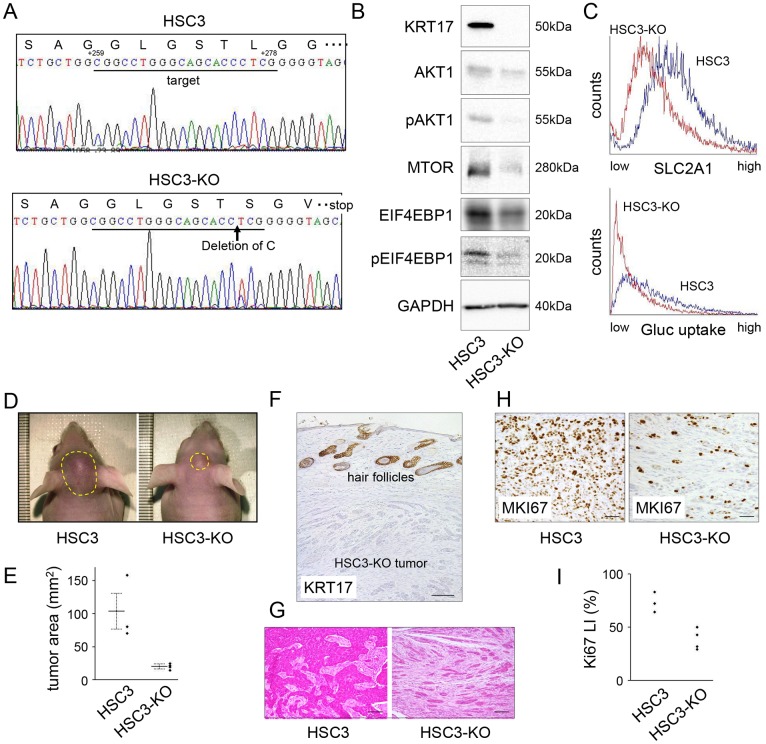
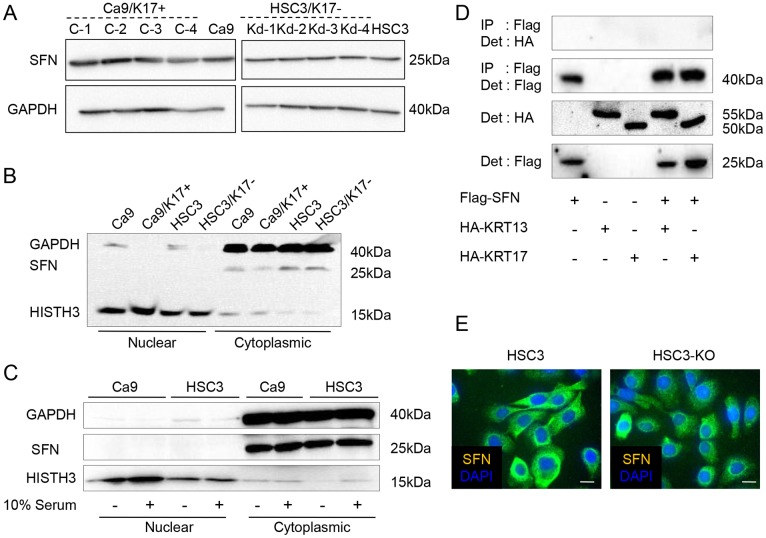
Keratin subtypes are selectively expressed depending on the cell type. They not only provide structural support, but regulate the metabolic processes and signaling pathways that control the growth of the epithelium. KRT17 (keratin 17) is induced in the regenerative epithelium and acts on diverse signaling pathways. Here, we demonstrate that KRT17 is invariably and permanently induced in oral squamous cell carcinoma (OSCC), as revealed by immunohistochemistry and cDNA microarray analysis. Two representative OSCC cell lines; KRT17-weakly expressing Ca9-22 and KRT17-highly expressing HSC3 were used to establish KRT17-overexpressing Ca9-22 and KRT17-knockdown HSC3 cells. Analysis of these cells revealed that KRT17 promoted cell proliferation and migration by stimulating the Akt/mTOR pathway. KRT17 also upregulated the expression of SLC2A1 (solute carrier family 2 member 1/Glut1) and glucose uptake. To further investigate the effect of KRT17 on tumorigenesis, KRT17-knockout HSC3 cells were established and were transplanted to the cephalic skin of nude mice. The tumors that developed from KRT17-knockout HSC3 cells had a lower Ki-67 labeling index and were significantly smaller compared to the controls. These results indicate that KRT17 stimulates the Akt/mTOR pathway and glucose uptake, thereby facilitating tumor growth. We could not confirm the relationship between KRT17 and SFN (stratifin) in the cells examined in this study. However, our study reinforces the concept that the cellular properties of cancer are regulated by a series of molecules similar to those found in wound healing. In OSCC, KRT17 acts as a pathogenic keratin that facilitates tumor growth through the stimulation of multiple signaling pathways, highlighting the importance of KRT17 as a multifunctional promoter of tumorigenesis.


Conflict of interest statement

Competing Interests: The authors have declared that no competing interests exist.

Figures

Fig 1
Fig 1. KRT17 expression was induced in the regenerative epithelium and oral squamous cell carcinoma (OSCC).
(A) KRT17 expression in regenerative epithelium. Hematoxylin and eosin (HE) staining (left panel) and immunohistochemical staining using the anti-KRT17 antibody (right panel). KRT17 expression was induced in the regenerative epithelium at the edge of the traumatic ulcer of the oral mucosa. Scale bar, 100 μm. (B) KRT17 expression in hyperplastic epithelium. Immunohistochemical staining using the anti-KRT17 antibody. In this buccal mucosa with nonspecific inflammation, KRT17 expression was induced in the basal cells. Note the scattered distribution of KRT17-positive cells in the basal layer. Scale bar, 100 μm. (C) cDNA microarray analysis of KRT16 and KRT17 in 43 OSCCs and 7 normal oral epithelia. The scales on the horizontal and vertical axes represent absolute signal values. Crosses denote each OSCC case and filled circles denote normal controls. The dashed lines were placed at the maximum values in the normal epithelium. (D-G) Immunohistochemical expression of KRT17 in OSCC. (D) KRT17 was expressed in the carcinoma in situ (left side), whereas KRT17 was not expressed in the normal epithelium (right side). Scale bar, 100 μm. (E, F, G) HE staining (upper panels) and immunohistochemical staining using the anti-KRT17 antibody (lower panels) in OSCC specimens. The upper and lower panels are serial sections from one sample. KRT17 expression was constantly induced in OSCC regardless of the histology. The levels and distributions of expression showed little variation across cases. Scale bar, 100 μm. (E) Keratinizing tumor nests and (F) small tumor islands of OSCC, both showing similar levels of ubiquitous KRT17 expression. Scale bars, 200 μm (E) and 100 μm (F). (G) Condylomatous tumor that showed highly differentiated histology was also positive for KRT17. Normal epithelium was present at the left side, showing negative staining. Scale bar, 1 mm. (H) Summary of immunohistological KRT17 expression in 50 OSCC cases. +, strong staining; -, weak or no staining. (I) Comparison between KRT17 expression and histological grade of differentiation in 43 OSCCs. G1, well differentiated; G2, moderately differentiated; G3, poorly differentiated. Bars depict the median. N is the total number of cases analyzed. (J) Comparison between the KRT17 expression and presence of lymph node metastasis in 43 OSCCs. Bars depict the median. N is the total number of cases analyzed.
Fig 2
Fig 2. Generation of KRT17-overexpressing and KRT17-knockdown oral cancer cell lines.
(A) Agarose gel electrophoresis of RT-PCR assays for the identification of KRT17 and GAPDH in various oral cancer cell lines. (B) Western blot analysis of various oral cancer cell lines for detection of KRT17 and GAPDH. (C) Northern blot analysis of Ca9 and HSC3 cells by hybridization with a KRT17 probe. (D) Immunofluorescent images showing filamentous staining of KRT17 in Ca9 (faint) and HSC3 cells. Scale bar, 10 μm. (E) Western blot analysis of KRT17-overexpressing Ca9 (Ca9/K17+) clones (C-1, C-2, C-3, and C-4), the parental Ca9 cells, KRT17-knockdown HSC3 (HSC3/K17-) clones (Kd-1, Kd-2, Kd-3, and Kd-4) and the parental HSC3 cells for detection of KRT17 and beta1-tubulin (TUBB). KRT17 cDNA was transfected into Ca9 to make KRT17-overexpressing cells (Ca9/K17+), and four independent clones (C-1, C-2, C-3, and C-4) were established. KRT17 expression in HSC3 was suppressed by miRNA-mediated knockdown, and four independent clones (Kd-1, Kd-2, Kd-3, and Kd-4) of KRT17-knockdown cells (HSC3/K17-) were established.
Fig 3
Fig 3. KRT17 promoted cell proliferation and migration.
(A) Cell proliferation assay after 72h of culture. C-4 showed a significantly higher rate of proliferation than the control. *P < 0.05 compared with the control. C-1, C-2, and C-3 showed a tendency towards elevated proliferation (0.05 < P < 0.1). HSC3/K17- showed significantly lower rates of proliferation than the control. Representative graphs of n = 3 independent experiments (each experiments comprised three technical replicates). **P < 0.01 and *P < 0.05 compared with the control. Data represent mean ± SEM. (B) Transwell migration assay using Boyden chambers. Cells (2 x 10⁵ cells/L) were suspended in serum-free medium and seeded into the upper chamber with pores of 8 μm. The lower chamber was filled with serum-containing medium. The upper chamber was confluent with cells during the assay. After 48 h, the cells that had migrated into the lower chamber through the filter were stained with crystal violet and counted in three microscopic fields per sample. Representative graphs of n = 3 independent experiments (each experiments comprised three technical replicates). **P < 0.01 compared with the control. Data represent mean ± SEM. (C) Transwell invasion assay. The filters were coated with an extracellular matrix protein mixture, and a transwell migration assay was conducted. Representative graphs of n = 3 independent experiments (each experiment comprised three technical replicates). **P < 0.01 compared with the control. Data represent mean ± SEM.
Fig 4
Fig 4. KRT17 stimulated the Akt and mTOR pathway.
(A) Representative images of western blot analysis of Ca9/K17+ (C-4), Ca9, HSC3/K17- (Kd-4), and HSC3 for detecting KRT17, AKT1, phosphorylated AKT1 (pAKT1), MTOR, EIF4EBP1, phosphorylated EIF4EBP1 (pEIF4EBP1), and beta1-tubulin (TUBB). Quantitative results measured by densitometric analysis of all the clones (C-1 to C-4 and Kd-1 to Kd-4) are shown in (B). Representative images of two assays. (B) Expression of AKT1, pAKT1, MTOR, EIF4EBP1 and pEIF4EBP1 in Ca9/K17+ (C-1, C-2, C-3, and C-4) and HSC3/K17- (Kd-1, Kd-2, Kd-3, and Kd-4) compared with Ca9 and HSC3, respectively, as revealed by densitometric analysis of the western blots. Expression level of protein X in a clone was normalized against TUBB and then against the control cells using the formula (Value of protein X in the clone / Value of TUBB in the clone) / (Value of protein X in the control cells / Value of TUBB in the control cells). The normalized expression levels were plotted on a log scale. Representative results of two independent assays that showed similar results. (C) Effect of mTOR-inhibitor rapamycin (RPM) and Akt-inhibitor perifosine (PRF) on proliferation of Ca9/K17+ (C-4) cells. Ca9/K17+ cells were treated with different concentrations of either RPM or PRF for 72 h and cell densities were measured. Representative graphs of three assays that showed similar results, each performed with n = 3 technical replicates. *P < 0.05 compared with the untreated control. Data represent mean ± SEM. (D) Transwell migration assay of Ca9/K17+ (C-4) treated with RPM and/or PRF (left panel). Transwell invasion assay of Ca9/K17+ (C-4) treated with RPM and/or PRF (right panel). Representative graphs of three assays that showed similar results, each performed with n = 3 technical replicates. **P < 0.01 and *P < 0.05 compared with the untreated control. Data represent mean ± SEM.
Fig 5
Fig 5. KRT17 upregulates SLC2A1 and glucose uptake.
(A) Representative images of western blot analysis of Ca9/K17+ (C-4), Ca9, HSC3/K17- (Kd-4) and HSC3 for detecting KRT17, SLC2A1, and beta1-tubulin (TUBB). Representative images of three assays. (B) Expression of SLC2A1 in Ca9/K17+ (C-1, C-2, C-3, and C-4) and HSC3/K17- (Kd-1, Kd-2, Kd-3, and Kd-4) compared with Ca9 and HSC3, respectively, as revealed by densitometric analysis of the western blots. Expression level of protein X in a clone was normalized against TUBB and then against the control cells using the formula (Value of protein X in the clone / Value of TUBB in the clone) / (Value of protein X in the control cells / Value of TUBB in the control cells). The normalized expression levels were plotted on a log scale. Representative results of three independent assays. (C) Glucose uptake assay of Ca9 and Ca9/K17+ (C-4) cells as measured by fluorescence microscopy. The cells were treated with a fluorescent glucose analogue for 2 h. The fluorescence image was digitally analyzed and the signal in individual cells was depicted as a brightness unit. The box plot illustrates the maximum, third quartile, median, first quartile and minimum signals of 100 cells. Representative results of three assays. (D) Glucose uptake assay as measured by flow cytometry. The cells were treated with the fluorescent glucose analogue for 2 h and were harvested for flow cytometric analysis (n = 1000). (E) cDNA microarray analysis of KRT17 and SLC2A1 in 43 oral squamous cell carcinomas (OSCCs) and 7 normal controls. SLC2A1 was significantly upregulated in OSCC (P < 0.001), with an approximate three-fold increase both in the mean and the median value. There was a positive correlation between SLC2A1 and KRT17 expression (r = 0.46; ***P < 0.001). The scales on the horizontal and vertical axes represent absolute signal values. Crosses denote each OSCC case and filled circles denote normal controls. (E) Immunohistochemical expression of SLC2A1 in normal tongue epithelium and tongue cancer. Expression was greatest in lymphocytes (arrows in left upper and lower panels). In the normal oral epithelium, SLC2A1 was weakly expressed in the basal and spinous cells (left upper panel). In OSCC, SLC2A1 was upregulated, showing a level of expression comparable with lymphocytes (left and right lower panels). Scale bar, 100 μm.
Fig 6
Fig 6. KRT17, pAKT1, MTOR, phosphorylated EIF4EBP1 (pEIF4EBP1) and SLC2A1 were concurrently upregulated in oral squamous cell carcinoma (OSCC).
(A) Representative images of immunohistochemical expression of KRT17, MTOR, pEIF4EBP1, SLC2A1 and pAKT1 in normal oral epithelium (normal) and OSCC (cancer). HE, hematoxylin and eosin staining. Scale bar, 100 μm. (B) Schematic representation of the immunohistochemical expression of KRT17, MTOR, pEIF4EBP1, SLC2A1 and pAKT1 in 50 OSCC cases. A blue square denotes increased expression in the individual OSCC case compared with the normal epithelium as an internal control. A white square denotes no immunohistochemical expression. A light-blue square denotes weak staining comparable to that in the normal epithelium. There was not a single case of downregulation of these proteins in OSCC.
Fig 7
Fig 7. KRT17 knockout inhibited tumor growth.
(A) Confirmation of KRT17 mutation in the KRT17-knockout cells (HSC3-KO). HSC3 was transfected with pSpCas9(BB)-2A-GFP carrying the KRT17 target sequence in KRT17 exon 3 and cloned by limited dilution following fluorescence activated cell sorting of transfected cells. Six independent clones, in which KRT17 protein expression was absent, were established. Of those, one clone (HSC3-KO) exhibited homo-allelic single-base deletion as revealed by PCR and direct sequencing of the genomic DNA, resulting in a frame shift and a premature stop codon. +259 and +278 denote the nucleotide positions corresponding to KRT17 cDNA when the A of the ATG of the initiator methionine codon is designated as position +1. (B) Western blot analysis of HSC3 and HSC3-KO, demonstrating the absence of KRT17 and reduced expression of phosphorylated pAKT1, MTOR, and pEIF4EBP1 in HSC3-KO. (C) Reduced SLC2A1 expression and glucose uptake in HSC3-KO, as revealed by flow cytometry. (D) Cells (5 x 10⁵) of HSC3 or HSC-KO were subcutaneously injected into the cephalic skin of nude mice (n = 4). One mouse transplanted with HSC3 died of an unknown cause on day 10. HSC3-KO cells developed smaller tumors than HSC3. The photographs were taken on day 15. The tumor areas are encircled by yellow dashed lines. (E) The tumor area was calculated following elliptic substitution of the macroscopic tumor margin using the photograph of the vertical view. The bold lines depict mean tumor areas. The error bars represent standard errors. (F) Immunohistochemical examination of the HSC3-KO tumor developed in the nude mice, confirming negative expression of KRT17. Since the antibody recognizes both human and mouse KRT17, the physiological expression of KRT17 was observed in the hair follicles. Scale bar, 200 μm. (G) Histology of the HSC3 tumor and the HSC3-KO tumor. The HSC3 tumor was composed of medium-to-large-sized tumor nests, whereas the HSC3-KO tumor was composed of small islands. Scale bar, 200 μm. (H) Immunohistochemical expression of MKI67 in the HSC3 tumor and the HSC3-KO tumor. Note that there were fewer cancer cells in the HSC3-KO photograph than in the HSC3 photograph. Scale bar, 200 μm. (I) The Ki-67 labeling indices (LI) were calculated as the percentage of MKI67-positive nuclei in the cancer cells after counting at least 1,000 tumor cells at X200 magnification. The tumor areas that were closest to the epidermis were used for analysis.
Fig 8
Fig 8. No direct relationship between KRT17 and stratifin (SFN).
(A) Western blot analysis of Ca9/17+ (C-1, C-2, C-3, and C-4), Ca9, HSC3/K17- (Kd-1, Kd-2, Kd-3, and Kd-4) and HSC3 for detecting SFN and GAPDH. (B) SFN was detected only in the cytoplasmic fractions of the cell lysates. Ca9, Ca9/K17+ (C-4), HSC3 and HSC3/K17- (Kd-4) were lysed and cytoplasmic and nuclear protein fractions were separately extracted. Western blot analysis for detecting SFN, GAPDH and HISTH3. Nuclear translocation or change in the expression level of SFN was not observed. Representative graphs of two assays that showed similar results. (C) Serum starvation did not alter the cytoplasmic localization of SFN. After serum starvation for 12 h, Ca9 and HSC3 cells were lysed and subjected to SDS-PAGE followed by western blot analysis. (D) Absence of KRT13 or KRT17 coprecipitation in SFN immunoprecipitate. 293T cell were transfected by the indicated combinations of plasmids and immunoprecipitation was performed using anti-Flag antibody followed by western blot analysis using an anti-HA antibody. (E) Cytoplasmic localization of SFN in HSC3 and HSC3-KO. Immunofluorescent images showing cytoplasmic staining of SFN (green) counterstained with DAPI (blue).

References

    1. Quinlan RA, Schiller DL, Hatzfeld M, Achtstatter T, Moll R, Jorcano JL, et al. Patterns of expression and organization of cytokeratin intermediate filaments. Ann N Y Acad Sci. 1985;455:282–306. . - PubMed
    1. Fuchs E. Keratins and the skin. Annu Rev Cell Dev Biol. 1995;11:123–53. . - PubMed
    1. Moll R, Divo M, Langbein L. The human keratins: biology and pathology. Histochem Cell Biol. 2008;129(6):705–33. 10.1007/s00418-008-0435-6 - DOI - PMC - PubMed
    1. Pan X, Hobbs RP, Coulombe PA. The expanding significance of keratin intermediate filaments in normal and diseased epithelia. Curr Opin Cell Biol. 2013;25(1):47–56. 10.1016/j.ceb.2012.10.018 - DOI - PMC - PubMed
    1. Mansbridge JN, Knapp AM. Changes in keratinocyte maturation during wound healing. J Invest Dermatol. 1987;89(3):253–63. . - PubMed

MeSH terms