

Comparative Genomics of the Sigatoka Disease Complex on Banana Suggests a Link between Parallel Evolutionary Changes in Pseudocercospora fijiensis and Pseudocercospora eumusae and Increased Virulence on the Banana Host
- PMID: 27513322
- PMCID: PMC4981473
- DOI: 10.1371/journal.pgen.1005904
Comparative Genomics of the Sigatoka Disease Complex on Banana Suggests a Link between Parallel Evolutionary Changes in Pseudocercospora fijiensis and Pseudocercospora eumusae and Increased Virulence on the Banana Host
Abstract
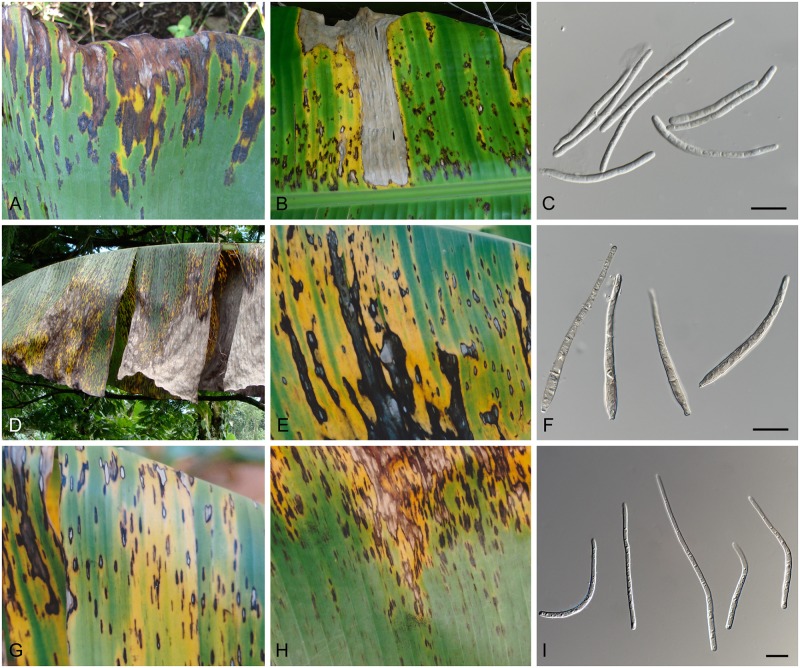
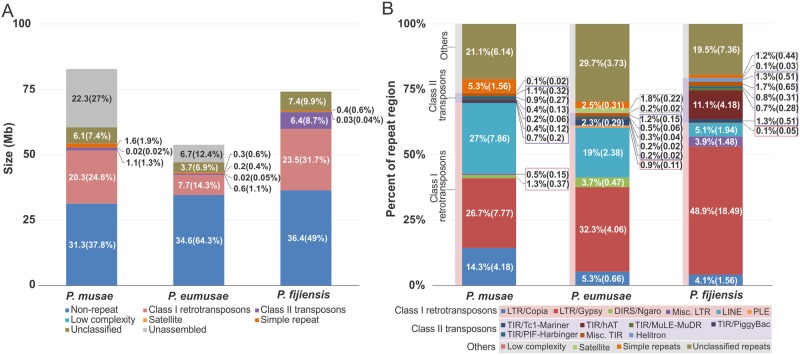
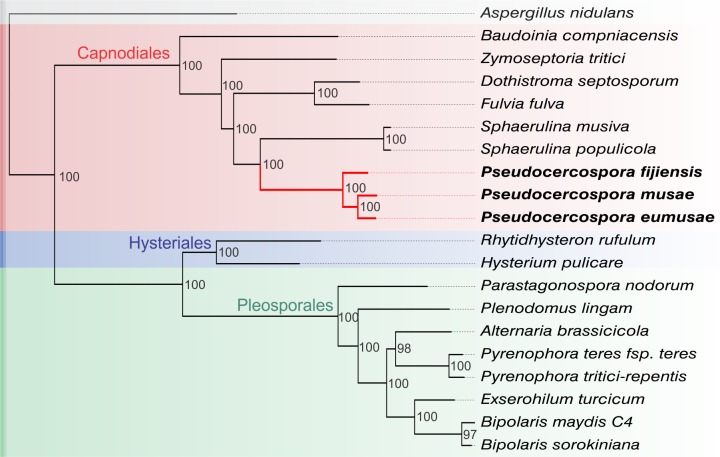
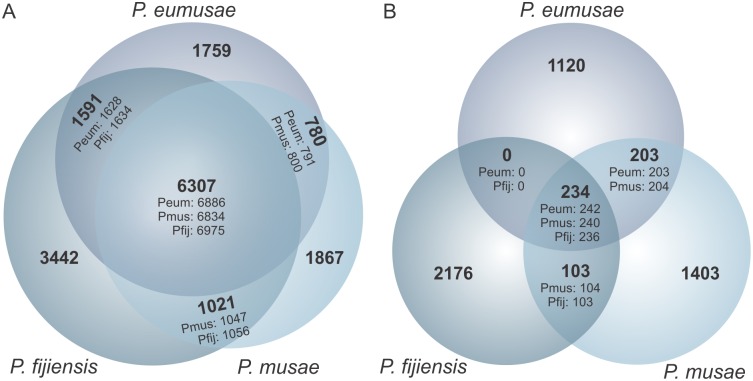
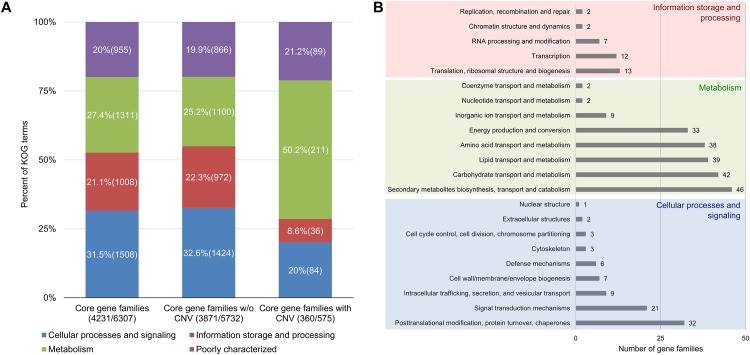
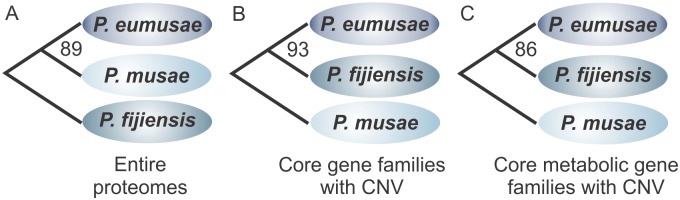
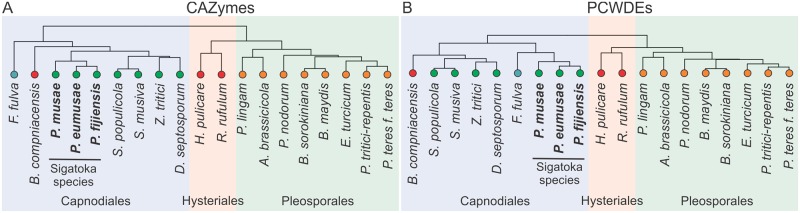
The Sigatoka disease complex, caused by the closely-related Dothideomycete fungi Pseudocercospora musae (yellow sigatoka), Pseudocercospora eumusae (eumusae leaf spot), and Pseudocercospora fijiensis (black sigatoka), is currently the most devastating disease on banana worldwide. The three species emerged on bananas from a recent common ancestor and show clear differences in virulence, with P. eumusae and P. fijiensis considered the most aggressive. In order to understand the genomic modifications associated with shifts in the species virulence spectra after speciation, and to identify their pathogenic core that can be exploited in disease management programs, we have sequenced and analyzed the genomes of P. eumusae and P. musae and compared them with the available genome sequence of P. fijiensis. Comparative analysis of genome architectures revealed significant differences in genome size, mainly due to different rates of LTR retrotransposon proliferation. Still, gene counts remained relatively equal and in the range of other Dothideomycetes. Phylogenetic reconstruction based on a set of 46 conserved single-copy genes strongly supported an earlier evolutionary radiation of P. fijiensis from P. musae and P. eumusae. However, pairwise analyses of gene content indicated that the more virulent P. eumusae and P. fijiensis share complementary patterns of expansions and contractions in core gene families related to metabolism and enzymatic degradation of plant cell walls, suggesting that the evolution of virulence in these two pathogens has, to some extent, been facilitated by convergent changes in metabolic pathways associated with nutrient acquisition and assimilation. In spite of their common ancestry and shared host-specificity, the three species retain fairly dissimilar repertoires of effector proteins, suggesting that they likely evolved different strategies for manipulating the host immune system. Finally, 234 gene families, including seven putative effectors, were exclusively present in the three Sigatoka species, and could thus be related to adaptation to the banana host.
Conflict of interest statement
The authors have declared that no competing interests exist.
Figures
Similar articles
-
Combating a Global Threat to a Clonal Crop: Banana Black Sigatoka Pathogen Pseudocercospora fijiensis (Synonym Mycosphaerella fijiensis) Genomes Reveal Clues for Disease Control.PLoS Genet. 2016 Aug 11;12(8):e1005876. doi: 10.1371/journal.pgen.1005876. eCollection 2016 Aug. PLoS Genet. 2016. PMID: 27512984 Free PMC article.
-
The Sigatoka Disease Complex Caused by Pseudocercospora spp. and Other Fungal Pathogens Associated with Musa spp. in Puerto Rico.Plant Dis. 2024 May;108(5):1320-1330. doi: 10.1094/PDIS-03-23-0433-RE. Epub 2024 May 3. Plant Dis. 2024. PMID: 37966473
-
The Mitochondrial Genome of a Plant Fungal Pathogen Pseudocercospora fijiensis (Mycosphaerellaceae), Comparative Analysis and Diversification Times of the Sigatoka Disease Complex Using Fossil Calibrated Phylogenies.Life (Basel). 2021 Mar 9;11(3):215. doi: 10.3390/life11030215. Life (Basel). 2021. PMID: 33803147 Free PMC article.
-
Mycosphaerella fijiensis, the black leaf streak pathogen of banana: progress towards understanding pathogen biology and detection, disease development, and the challenges of control.Mol Plant Pathol. 2011 May;12(4):307-28. doi: 10.1111/j.1364-3703.2010.00672.x. Epub 2010 Nov 18. Mol Plant Pathol. 2011. PMID: 21453427 Free PMC article. Review.
-
Genetic Characteristics and Metabolic Interactions between Pseudocercospora fijiensis and Banana: Progress toward Controlling Black Sigatoka.Plants (Basel). 2022 Mar 31;11(7):948. doi: 10.3390/plants11070948. Plants (Basel). 2022. PMID: 35406928 Free PMC article. Review.
Cited by
-
A new species in the Mycosphaerellaceae from Cecidomyiidae leaf galls on Avicennia marina in South Africa.Antonie Van Leeuwenhoek. 2021 May;114(5):515-526. doi: 10.1007/s10482-021-01537-3. Epub 2021 Feb 28. Antonie Van Leeuwenhoek. 2021. PMID: 33641038
-
Pseudocercospora and allied genera associated with leaf spots of banana (Musa spp.).Fungal Syst Evol. 2021 Jun;7:1-19. doi: 10.3114/fuse.2021.07.01. Epub 2020 Oct 30. Fungal Syst Evol. 2021. PMID: 34124615 Free PMC article.
-
Genome-scale data resolve ancestral rock-inhabiting lifestyle in Dothideomycetes (Ascomycota).IMA Fungus. 2019 Oct 30;10:19. doi: 10.1186/s43008-019-0018-2. eCollection 2019. IMA Fungus. 2019. PMID: 32647623 Free PMC article.
-
Combating the Sigatoka Disease Complex on Banana.PLoS Genet. 2016 Aug 11;12(8):e1006234. doi: 10.1371/journal.pgen.1006234. eCollection 2016 Aug. PLoS Genet. 2016. PMID: 27513644 Free PMC article. No abstract available.
-
Genome sequencing and annotation of Cercospora sesami, a fungal pathogen causing leaf spot to Sesamum indicum.3 Biotech. 2023 Feb;13(2):55. doi: 10.1007/s13205-023-03468-4. Epub 2023 Jan 19. 3 Biotech. 2023. PMID: 36685323 Free PMC article.
References
-
- Arias P, Dankers C, Liu P, Pilkauskas P. The world banana economy forum 1985–2002. Rome: Food and Agriculture Organization of the United Nations; 2003.
-
- Jacome L, Lepoivre P, Marin D, Ortiz R, Romero R, Escalant J, editors. Mycosphaerella leaf spot diseases of bananas: present status and outlook. Proceedings of the Workshop on Mycosphaerella leaf spot dis-eases held in San Jose, Costa Rica on; 2002.
-
- Jones D, editor The distribution and importance of the Mycosphaerella leaf spot diseases of banana. WORKSHOP ON MYCOSPHAERELLA LEAF SPOT DISEASES; 2003.
Publication types
MeSH terms
LinkOut - more resources
Full Text Sources
Other Literature Sources
