. 2016 Aug 11;11(8):e0160853.
doi: 10.1371/journal.pone.0160853. eCollection 2016.

A Public Database of Memory and Naive B-Cell Receptor Sequences

Affiliations

A Public Database of Memory and Naive B-Cell Receptor Sequences

William S DeWitt et al. PLoS One. .

Abstract

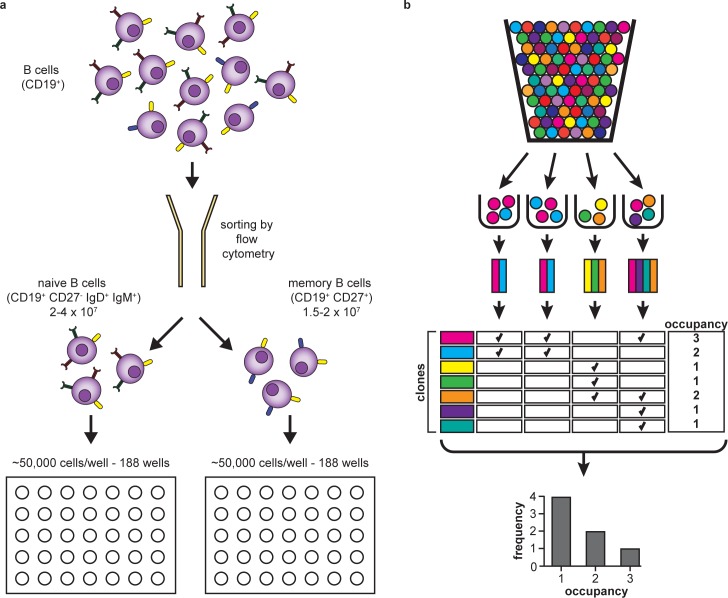
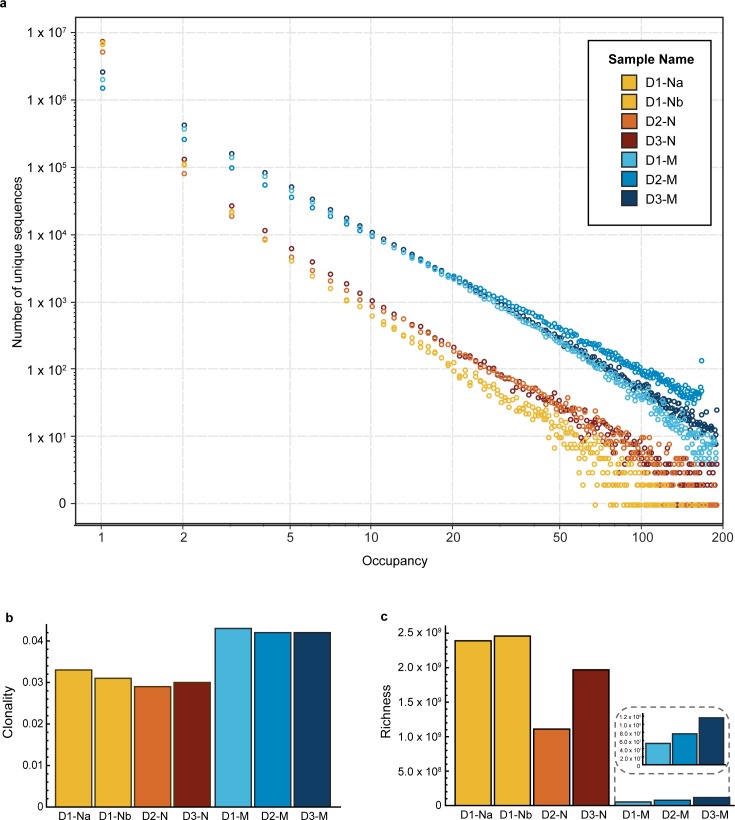
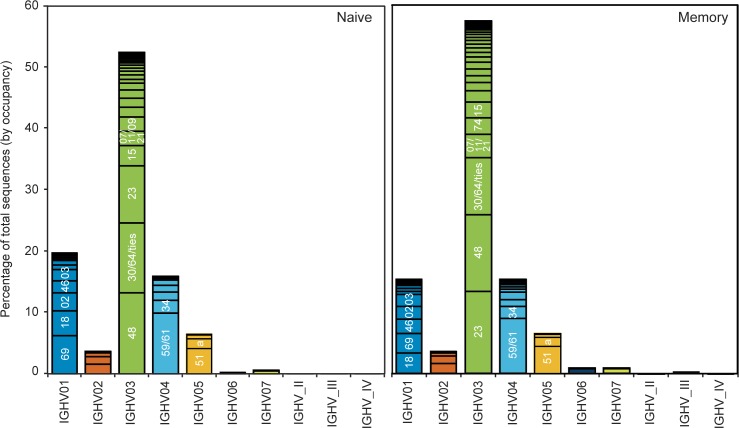
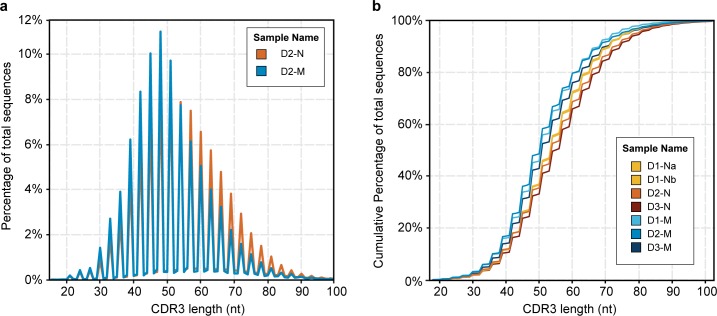
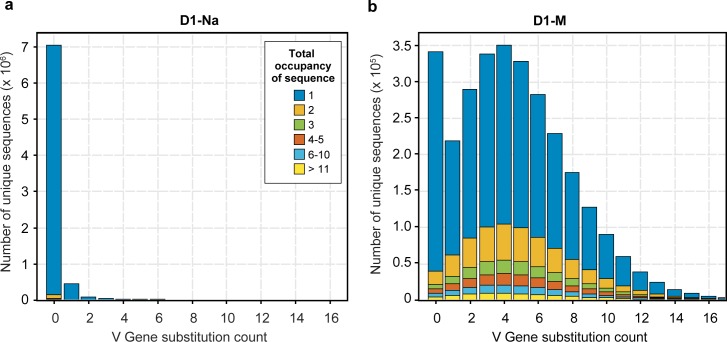
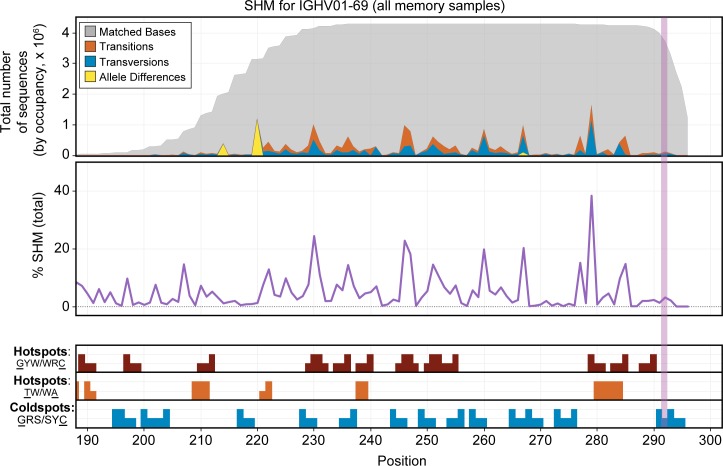
The vast diversity of B-cell receptors (BCR) and secreted antibodies enables the recognition of, and response to, a wide range of epitopes, but this diversity has also limited our understanding of humoral immunity. We present a public database of more than 37 million unique BCR sequences from three healthy adult donors that is many fold deeper than any existing resource, together with a set of online tools designed to facilitate the visualization and analysis of the annotated data. We estimate the clonal diversity of the naive and memory B-cell repertoires of healthy individuals, and provide a set of examples that illustrate the utility of the database, including several views of the basic properties of immunoglobulin heavy chain sequences, such as rearrangement length, subunit usage, and somatic hypermutation positions and dynamics.


Conflict of interest statement

Competing Interests: C.S.C. owns stock and receives consulting fees from Adaptive Biotechnologies. W.S.D., T.M.S., A.M.S., M.V., R.O.E., and H.S.R. are employees of Adaptive Biotechnologies with salary and stock options. There are no patents, products in development, or marketed products to declare. This does not alter the authors' adherence to all the PLOS ONE policies on sharing data and materials.

Figures

Fig 1
Fig 1. Experimental and informatic design.
(a) Peripheral blood samples from three healthy donors were sorted using flow cytometry to isolate naive (CD19+ CD27- IgD+ IgM+) and memory (CD19+ CD27+) B cells. For each sample, approximately 107 cells were distributed into two 96-well plates (i.e., into 188 wells, resulting in ~50,000 cells per well), and processed by immunosequencing. (b) Schematic of the ‘urn sampling’ quantitation method. Cells are represented by colored balls, with each color indicating a different clone identity. Each ball (cell) is randomly allocated to a sample bin (well). Occupancy is calculated after censoring count information, and thus is expressed as presence or absence. The majority of clones are present in just one out of 188 wells, indicating that they were almost certainly represented by a single cell in the original sample.
Fig 2
Fig 2. Inference of diversity in the naive and memory B-cell repertoires.
(a) The graph shows the distribution of unique sequences, as the number of unique sequences (y-axis) versus their occupancy (x-axis) for the naive (orange) and memory (blue) samples for the three donors (D1, D2 and D3, including two technical replicates for the naive sample from Donor 1). The vast majority of the sequences have occupancy of 1. (b) Clonality index for all samples. (c) Richness index for all samples. While the clonality index is higher for memory samples, the richness index is higher for the naive samples.
Fig 3
Fig 3. V family and V gene usage patterns.
The histograms show the relative percent of total sequences (by occupancy) for each of the IGHV families (as shown under the graphs), for the naive (left panel) and memory (right panel) samples, aggregated for the three donors. Within each family, discrete bands represent each of the individual genes. The most abundant genes within each family are indicated (e.g., 69 in IGHV01 refers to the gene IGHV01-69). Overall, memory samples contain fewer IGHV01 and more IGHV03 family sequences than naive samples, with some gene-level differences evident as well.
Fig 4
Fig 4. Comparison of CDR3 lengths in naive versus memory B-cell samples.
(a) The graph shows the normalized percentage of total sequences for the naive (orange) and memory B cells (blue) from donor D2. (b) The graph shows the cumulative percentage of total sequences at a given CDR3 length for all naive and memory samples, as indicated in the inset. The technical replicates for donor D1 overlap closely and are not distinguishable in this figure. The memory repertoire is consistently 3 nucleotides (or 1 amino acid) shorter than the naive repertoire at the same cumulative frequency.
Fig 5
Fig 5. Comparison of Somatic Hyper Mutation in paired naive and memory B-cell samples from the same donor.
The figure shows data for the naive (a) and memory sample (b) from Donor 1, which is representative of all three donors. The x-axis corresponds to the number of substitutions differing from the germline V gene sequence, and the y-axis indicates the number of unique sequences that display that number of substitutions. The colors indicate different total well occupancies, with blue indicating singletons present in just one well, and the other colors showing progressively higher well occupancy, as indicated in the figure. The majority of the sequences in the naive B-cell sample have 0 substitutions and correspond to low abundance clones observed in a single well (blue). In contrast, the memory B cell sample from the same individual shows a much broader distribution of substitutions, as well as many more sequences with occupancy greater than 1.
Fig 6
Fig 6. Somatic hypermutation pattern observed over the sequenced region of the IGHV01-69 gene.
The figure includes combined data from the memory B-cell population for all 3 donors. The top panel shows the total distribution of sequenced bases by occupancy for the primary allele of IGHV01-69. Nucleotides that match the germline sequence are displayed in gray. Transitions are shown in orange and transversions in blue. Allelic differences, which are also seen in the naive samples, are indicated in yellow. The vertical dotted line marks the average start of the CDR3 region. The middle panel shows the normalized percentage SHM by base for this gene across the memory B cell samples for all three donors. The bottom panel shows suspected SHM hotspot (red and orange bars) and coldspot (blue bars) motifs present in the sequence of this gene over the region assayed. Positions with higher bars indicate bases targeted within the motif (underlined in the legend to the left). The GYW/WRC pattern (red) explains most of the significant sites of SHM for this gene, but some spots of high mutation are not captured by the displayed motifs. In the data viewer, this view can be generated for any V gene and for any combination of data sets.

References

    1. Davis MM, Calame K, Early PW, Livant DL, Joho R, Weissman IL, et al. An immunoglobulin heavy-chain gene is formed by at least two recombinational events. Nature. 1980;283(5749):733–9. Epub 1980/02/21. . - PubMed
    1. Watson CT, Steinberg KM, Huddleston J, Warren RL, Malig M, Schein J, et al. Complete haplotype sequence of the human immunoglobulin heavy-chain variable, diversity, and joining genes and characterization of allelic and copy-number variation. Am J Hum Genet. 2013;92(4):530–46. Epub 2013/04/02. 10.1016/j.ajhg.2013.03.004 - DOI - PMC - PubMed
    1. Murphy K, Travers P, Walport M. Janeway's Immunobiology. 7th ed. New York, NY: Garland Science; 2008.
    1. Muramatsu M, Kinoshita K, Fagarasan S, Yamada S, Shinkai Y, Honjo T. Class switch recombination and hypermutation require activation-induced cytidine deaminase (AID), a potential RNA editing enzyme. Cell. 2000;102(5):553–63. Epub 2000/09/28. . - PubMed
    1. Jacob J, Kelsoe G, Rajewsky K, Weiss U. Intraclonal generation of antibody mutants in germinal centres. Nature. 1991;354(6352):389–92. Epub 1991/12/05. 10.1038/354389a0 . - DOI - PubMed

Substances