. 2016 Aug 11:6:30383.
doi: 10.1038/srep30383.

Long-Term Training with a Brain-Machine Interface-Based Gait Protocol Induces Partial Neurological Recovery in Paraplegic Patients

Affiliations

Long-Term Training with a Brain-Machine Interface-Based Gait Protocol Induces Partial Neurological Recovery in Paraplegic Patients

Ana R C Donati et al. Sci Rep. .

Abstract

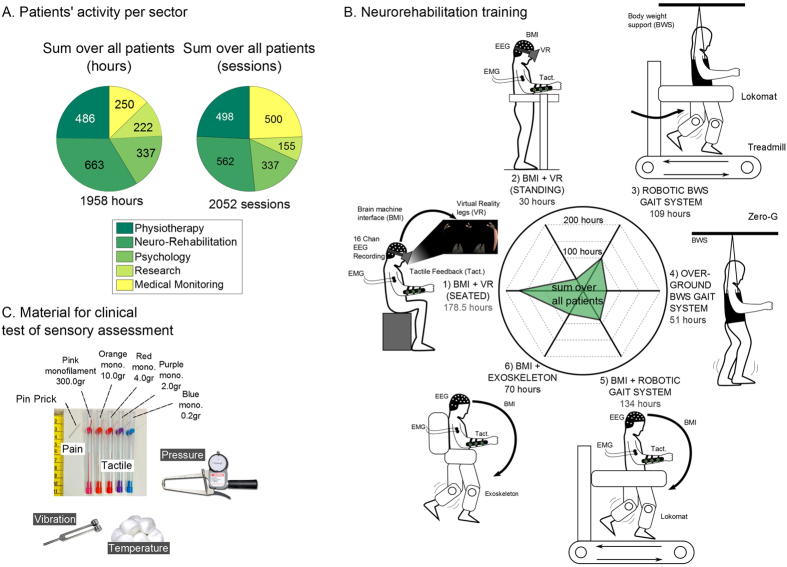
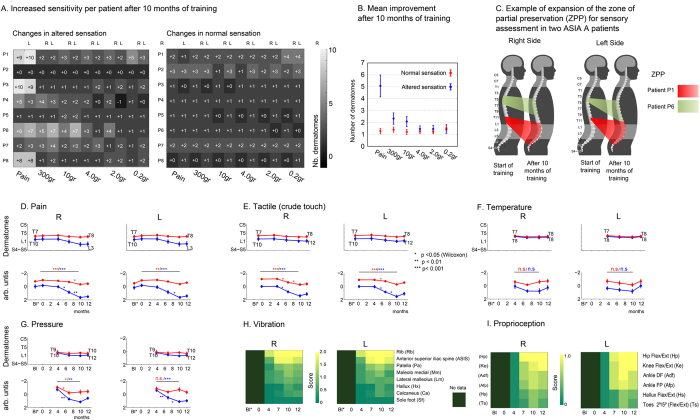
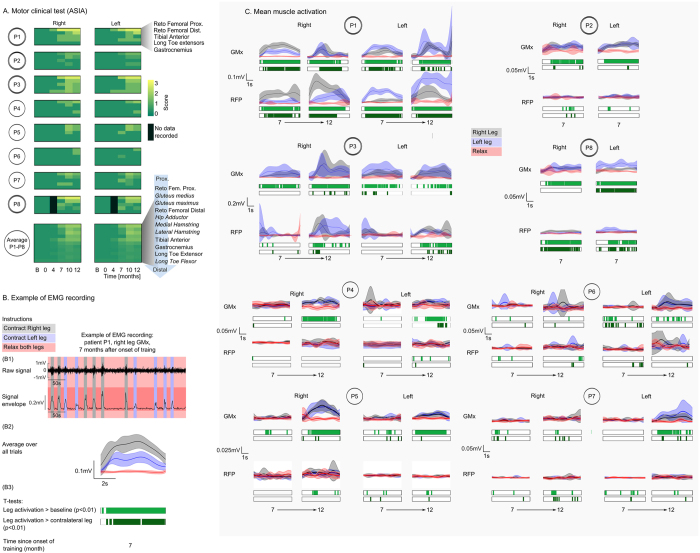
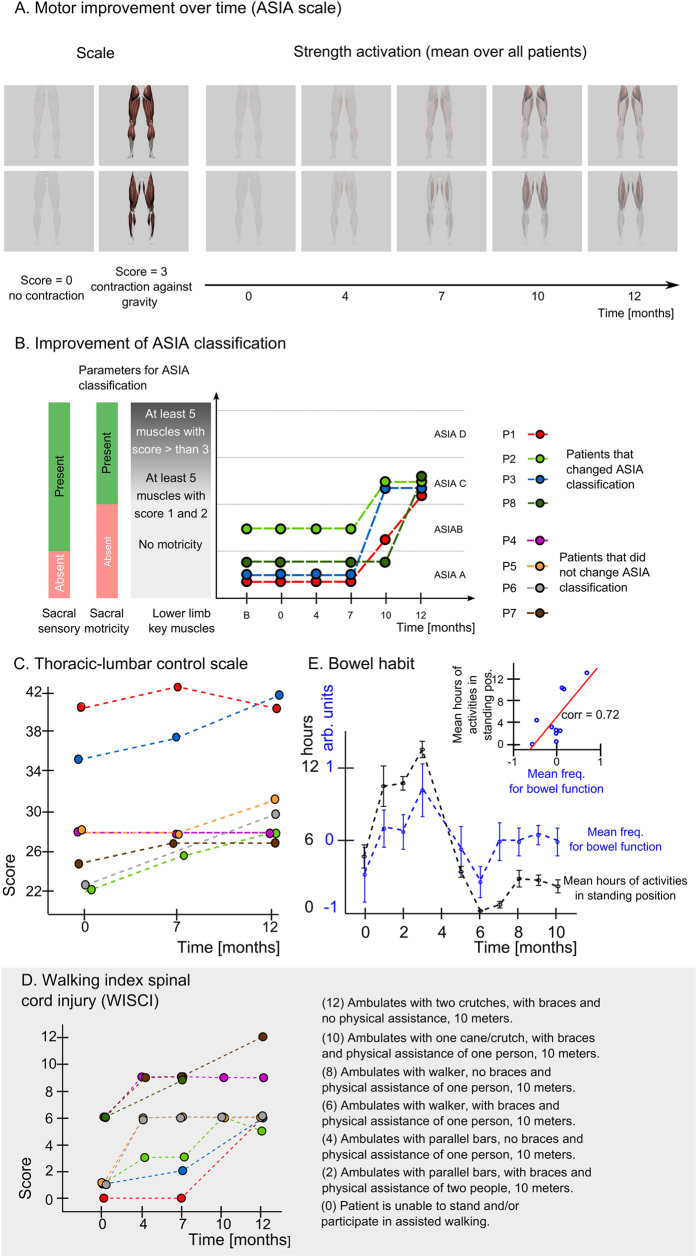
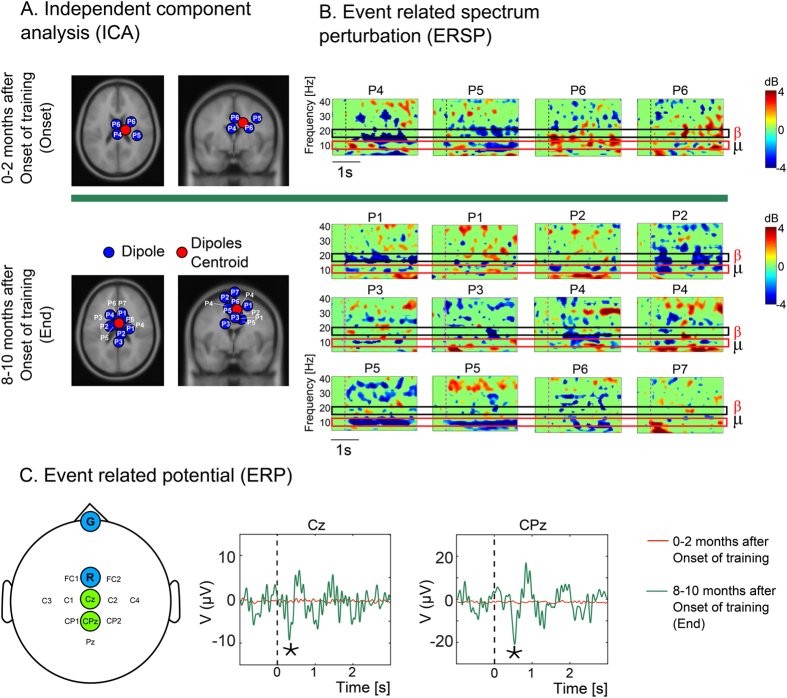
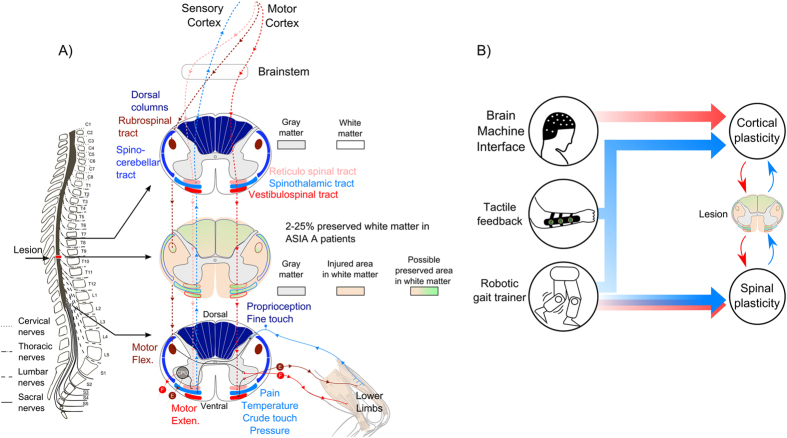
Brain-machine interfaces (BMIs) provide a new assistive strategy aimed at restoring mobility in severely paralyzed patients. Yet, no study in animals or in human subjects has indicated that long-term BMI training could induce any type of clinical recovery. Eight chronic (3-13 years) spinal cord injury (SCI) paraplegics were subjected to long-term training (12 months) with a multi-stage BMI-based gait neurorehabilitation paradigm aimed at restoring locomotion. This paradigm combined intense immersive virtual reality training, enriched visual-tactile feedback, and walking with two EEG-controlled robotic actuators, including a custom-designed lower limb exoskeleton capable of delivering tactile feedback to subjects. Following 12 months of training with this paradigm, all eight patients experienced neurological improvements in somatic sensation (pain localization, fine/crude touch, and proprioceptive sensing) in multiple dermatomes. Patients also regained voluntary motor control in key muscles below the SCI level, as measured by EMGs, resulting in marked improvement in their walking index. As a result, 50% of these patients were upgraded to an incomplete paraplegia classification. Neurological recovery was paralleled by the reemergence of lower limb motor imagery at cortical level. We hypothesize that this unprecedented neurological recovery results from both cortical and spinal cord plasticity triggered by long-term BMI usage.


Figures

Figure 1
Figure 1. Methodology.
(A) Cumulated number of hours and sessions for all patients over 12 months. We report cumulated hours for the following activities: classic physiotherapy activities (e.g. strengthening/stretching), gait-BMI-based neurorehabilitation, one-to-one consultations with a psychologist, periodic measurements for research purposes and routine medical monitoring (vital signs, etc.). (B) Neurorehabilitation training paradigm and corresponding cumulated number of hours for all patients: 1) Brain controlled 3D avatar with tactile feedback when patient is seated on a wheelchair or 2) in an orthostatic position on a stand-in-table, 3) Gait training using a robotic body weight support (BWS) system on a treadmill (LokomatPro, Hocoma), 4) Gait training using an overground BWS system (ZeroG, Aretech). 5–6) Brain controlled robotic gait training integrated with the sensory support of the tactile feedback at gait devices (BWS system on a treadmill or the exoskeleton). (C) Material used for the clinical sensory assessment of dermatomes in the trunk and lower limbs: to evaluate pain sensitivity, examiner used a pin-prick in random positions of the body segments. Nylon monofilaments applying forces ranging between 300 to 0.2 grams on the skin, were used to evaluate patients’ sensitivity for crude to fine touch. Dry cotton and alcohol swabs were used to assess respectively warm and cold sensation. Vibration test was done using a diapason on patients’ legs bone surface. Deep pressure was assessed with an adapted plicometer in every dermatome.
Figure 2
Figure 2. Sensory improvement after neurorehabilitation training.
(A) Left table reports the improvement for altered sensation (hyper or hypoesthesia) and the right table reports normal sensation. Number of dermatomes recovered after 10 months training compared to baseline (recorded at day 1 of training) for pain and tactile sensory modalities for all patients and body sides. Sensory modalities are reported by pain, crude touch (applied with a 300 gr. monofilament), and gradually more selective touch (applied with 10 gr. to 0.2 gr. monofilaments). The brightness of each colored square represents the magnitude of improvement, considering each monofilament and pin employed (lightest represents highest improvement). (B) Average sensory improvement (mean +/− SEM over all patients) after 10 months training. (C) Example of improvement in the Zone of Partial Preservation for sensory evaluation for two patients. (D–G) Mean +/− SEM of lowest dermatome with normal (red) or altered (blue) sensation for (D) Pain (E) Tactile – crude touch, pink monofilament (F) Temperature and (G) Pressure on the body calculated over all patients. From (DG), y-axis exhibits dermatomes in a cranio-caudal order, following the anatomic sequence. Baseline was recorded during the year following the injury, time 0 represents the starting day of our training. For each modality we show the average over raw (top graph) and z-scored data (lower graph). P-values for Wilcoxon rank sum test are reported on z-scored data (*p < 0.05, **p < 0.01, ***p < 0.001). (H) Mean score for perception of vibration on eight leg bones presented (most proximal to most distal order). Score convention was the following: 0 for no sensation, 1 for altered sensation and 2 for normal sensation. (I) Mean score for proprioception (0: absent, 1: present) over lower limb joints. Note that measurements for temperature, vibration and proprioception were introduced 4 months after the beginning of the training.
Figure 3
Figure 3. Clinical and neurophysiological assessments of lower limb motor recovery.
(A) Detail of key muscle improvement per patient, according to clinical evaluation (ASIA) for all patients and the average over all 8 patients for key and secondary lower limb muscles listed in a proximal to distal order (secondary muscles are in italic). Patients that changed classification to ASIA C after 12 months of training have 2 lines rings around their names. (B) Details of the EMG recording procedure in SCI patients. (B1) Raw EMG for the right gluteus maximus muscle for patient P1 is shown at the top of the topmost graph. The lower part of this graph depicts the envelope of the raw EMG, after the signal was rectified and low pass filtered at 3 HZ. Gray shaded areas represent periods where the patient was instructed to move the right leg, while the blue shaded areas indicate periods of left leg movement. Red areas indicate periods where patients were instructed to relax both legs. (B2) All trials over one session were averaged (mean +/− standard deviation envelopes are shown) and plotted as a function of instruction type (gray envelope = contract right leg; blue = contract left leg; red = relax both legs). (B3) Below the averaged EMG record, light green bars indicate instances in which the voluntary muscle contraction (right leg) was significantly different (t-test, p < 0.01) than the baseline (periods where she/he was instructed to relax both legs). Dark green bars depict periods in which there was a significant difference (p < 0.01) between muscle contraction in the right versus the left leg. (C) EMG envelops and t-tests for all recording sessions, involving 4 muscles, for all 8 patients: left and right gluteus maximus (GMx) and reto femoral proximal (RFP) muscles. Color convention and figure organization follows the one of panel B. Data was collected after 7 months of training for all patients and for all but patients P2 and P8 after 12 months.
Figure 4
Figure 4. Clinical and functional improvements.
(A) Graphical representation of clinical assessment of motor strength, calculated with the ASIA protocol, for key muscles and other muscles in the lower limb (mean over all patients). The scale for a given muscle goes from complete transparency for no muscle activation (muscle strength score 0) to contraction against gravity (score 3). Time 0 of x-axis means day 1 of the neuro-rehabilitation training. (B) Patients with ASIA classification improvements: four patients changed ASIA classification over the course of the neurorehabilitation training, three moved from ASIA A to C and one moved from ASIA B to C. ASIA A is characterized by absence of both motor and sensory functions in the lowest sacral area, ASIA B by the presence of sensory functions below the neurological level of injury, including sacral segments S4-S5 and no motor function is preserved more than three levels below the motor level on either side of the body, ASIA C by the presence of voluntary anal sphincter contraction, or sacral sensory sparing with sparing of motor function more than three levels below the motor level, majority of key muscles have muscle grade less than 323. (C) Thoracic-lumbar control scale evaluates quantitatively motor skill of the thoracolumbar region. Score ranges between 0 and 65. It has 10 items that considers supine, prone, sitting and standing postures. In the present study, the last item (orthostatic position) was scored 0 due to the limitations of the pathology. (D) Functional assessment of autonomy in walking given by the Walking Index for Spinal Cord Injury scale. The scale ranges between 0, for a patient who is unable to stand and/or to participate in assisted walking, to 20 for a patient who ambulates 10 meters with no walking devices, no braces and no physical assistance. (E) Correlation between average time spent in a standing position in orthostatic or gait training (mean +/− SEM, values are average hours per month) and mean frequency for bowel function (values calculated per month and z-scored per patient).
Figure 5
Figure 5. EEG recording.
(A) Functional Cortical dynamics over the leg sensory motor area over time. Projection of the position of dipoles found by Independent Component Analysis during leg motor imagery. Analysis revealed that the number of dipoles observed in the S1/M1 cortex evolved from four at onset of the protocol to 12 at the end of training. Two sets of sessions are shown for patients 1 to 7: one recorded in the first 2 months of training (Onset) and one recorded between the 7th and 9th month of training (End). (B) For the onset and end of training, the Event Related Spectral Perturbation (ERSP) is shown for each of the Independent Components (IC) depicted in panel A. At the onset of training, one IC was found for P4 and P5, and two for patient P6. At the end of training, two ICs were found for each of the following patients: P1, P2, P3, P4 and P5. A single IC was identified for patient P6, and one for patient P7; and none for P8. Decrease in power in Beta waves (16·5–20 Hz) is associated with muscle contraction; suppression mu wave (7·5–12·5 Hz) are related to motor actions. (C) Mean event related potential over all patients for two central electrodes (Cz and CPz) for Onset and End of training period. Significant desynchronization or synchronization is marked with an ‘*’.
Figure 6
Figure 6. Hypothesis for mechanism of neurological improvement in SCI patients.
(A) Example of spinal cord lesion in the thoracic area. Cross section is shown in the three parts of the spinal cord: at the lesion level, on top and under the lesion. Example of two efferent and one afferent pathways and their corresponding spinal tract are shown (rubrospinal and vestibulospinal tracts; spinothalamic tract respectively). At the lesion level we hypothesize preservation of 2–25% of white matter which might include the spinothalamic tract (sensory: pain, temperature, crude touch and pressure), vestibulospinal tract (motor: extensors muscles), rubrospinal tract (motor: flexors muscles) and dorsal columns (sensory: proprioception and fine touch). Under the lesion, Central Pattern Generators (CPGs) and its interaction with descending pathways (reticulospinal tract) and sensory afferents, modulating the gait pattern. (B) Proposed components for the rehabilitation mechanism: direct brain control of virtual or robotic legs, continuous stream of tactile stimulation representing the missing haptic feedback from the legs and robotic actuators to train patients to walk. Cortical and spinal plasticity are hypothesized to change and to modulate neurological circuits in the preserved area around the lesion through motor (red) and sensory (blue) connections.

Comment in

Similar articles

Cited by

References

    1. Alexeeva N. et al.. Comparison of training methods to improve walking in persons with chronic spinal cord injury: a randomized clinical trial. J. Spinal Cord Med. 34, 362–379, doi: 10.1179/2045772311Y.0000000018 (2011). - DOI - PMC - PubMed
    1. Field-Fote E. C. & Roach K. E. Influence of a locomotor training approach on walking speed and distance in people with chronic spinal cord injury: a randomized clinical trial. Phys. Ther. 91, 48–60, doi: 10.2522/ptj.20090359 (2011). - DOI - PMC - PubMed
    1. Hartigan C. et al.. Mobility Outcomes Following Five Training Sessions with a Powered Exoskeleton. Top Spinal Cord Inj Rehabil 21, 93–99, doi: 10.1310/sci2102-93 (2015). - DOI - PMC - PubMed
    1. Zeilig G. et al.. Safety and tolerance of the ReWalk exoskeleton suit for ambulation by people with complete spinal cord injury: a pilot study. J. Spinal Cord Med. 35, 96–101, doi: 10.1179/2045772312Y.0000000003 (2012). - DOI - PMC - PubMed
    1. King C. E. et al.. Brain-computer interface driven functional electrical stimulation system for overground walking in spinal cord injury participant. In Conf Proc IEEE Eng Med Biol Soc.2015/01/09 edn 1238–1242. Conf Proc IEEE Eng Med Biol Soc, Chicago, IL, August 26–30, 2014. - PMC - PubMed

Publication types