Targeting of the P2X7 receptor in pancreatic cancer and stellate cells
- PMID: 27513892
- PMCID: PMC5095874
- DOI: 10.1002/ijc.30380
Targeting of the P2X7 receptor in pancreatic cancer and stellate cells
Abstract
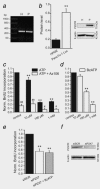
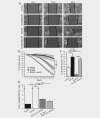
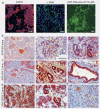
The ATP-gated receptor P2X7 (P2X7R) is involved in regulation of cell survival and has been of interest in cancer field. Pancreatic ductal adenocarcinoma (PDAC) is a deadly cancer and new markers and therapeutic targets are needed. PDAC is characterized by a complex tumour microenvironment, which includes cancer and pancreatic stellate cells (PSCs), and potentially high nucleotide/side turnover. Our aim was to determine P2X7R expression and function in human pancreatic cancer cells in vitro as well as to perform in vivo efficacy study applying P2X7R inhibitor in an orthotopic xenograft mouse model of PDAC. In the in vitro studies we show that human PDAC cells with luciferase gene (PancTu-1 Luc cells) express high levels of P2X7R protein. Allosteric P2X7R antagonist AZ10606120 inhibited cell proliferation in basal conditions, indicating that P2X7R was tonically active. Extracellular ATP and BzATP, to which the P2X7R is more sensitive, further affected cell survival and confirmed complex functionality of P2X7R. PancTu-1 Luc migration and invasion was reduced by AZ10606120, and it was stimulated by PSCs, but not by PSCs from P2X7(-/-) animals. PancTu-1 Luc cells were orthotopically transplanted into nude mice and tumour growth was followed noninvasively by bioluminescence imaging. AZ10606120-treated mice showed reduced bioluminescence compared to saline-treated mice. Immunohistochemical analysis confirmed P2X7R expression in cancer and PSC cells, and in metaplastic/neoplastic acinar and duct structures. PSCs number/activity and collagen deposition was reduced in AZ10606120-treated tumours.
Keywords: AZ10606120; P2X7; PDAC; fibrosis; stellate cells.
© 2016 The Authors International Journal of Cancer published by John Wiley & Sons Ltd on behalf of UICC.
Figures


Similar articles
-
The P2X7 receptor regulates cell survival, migration and invasion of pancreatic ductal adenocarcinoma cells.Mol Cancer. 2015 Nov 25;14:203. doi: 10.1186/s12943-015-0472-4. Mol Cancer. 2015. PMID: 26607222 Free PMC article.
-
The P2X7 Receptor Stimulates IL-6 Release from Pancreatic Stellate Cells and Tocilizumab Prevents Activation of STAT3 in Pancreatic Cancer Cells.Cells. 2021 Jul 29;10(8):1928. doi: 10.3390/cells10081928. Cells. 2021. PMID: 34440697 Free PMC article.
-
Galectin-3 Mediates Tumor Cell-Stroma Interactions by Activating Pancreatic Stellate Cells to Produce Cytokines via Integrin Signaling.Gastroenterology. 2018 Apr;154(5):1524-1537.e6. doi: 10.1053/j.gastro.2017.12.014. Epub 2017 Dec 21. Gastroenterology. 2018. PMID: 29274868
-
Pancreatic stellate cells and pancreas cancer: current perspectives and future strategies.Eur J Cancer. 2014 Oct;50(15):2570-82. doi: 10.1016/j.ejca.2014.06.021. Epub 2014 Aug 1. Eur J Cancer. 2014. PMID: 25091797 Review.
-
Fibrotic Fortresses and Therapeutic Frontiers: Pancreatic Stellate Cells and the Extracellular Matrix in Pancreatic Cancer.Cancer Med. 2025 Jun;14(11):e70788. doi: 10.1002/cam4.70788. Cancer Med. 2025. PMID: 40437741 Free PMC article. Review.
Cited by
-
Ion Channels Orchestrate Pancreatic Ductal Adenocarcinoma Progression and Therapy.Front Pharmacol. 2021 Jan 19;11:586599. doi: 10.3389/fphar.2020.586599. eCollection 2020. Front Pharmacol. 2021. PMID: 33841132 Free PMC article. Review.
-
Inhibition of purinergic P2X receptor 7 (P2X7R) decreases granulocyte-macrophage colony-stimulating factor (GM-CSF) expression in U251 glioblastoma cells.Sci Rep. 2020 Sep 9;10(1):14844. doi: 10.1038/s41598-020-71887-x. Sci Rep. 2020. PMID: 32908225 Free PMC article.
-
pH-Channeling in Cancer: How pH-Dependence of Cation Channels Shapes Cancer Pathophysiology.Cancers (Basel). 2020 Sep 2;12(9):2484. doi: 10.3390/cancers12092484. Cancers (Basel). 2020. PMID: 32887220 Free PMC article. Review.
-
Purinergic and Adenosinergic Signaling in Pancreatobiliary Diseases.Front Physiol. 2022 Mar 14;13:849258. doi: 10.3389/fphys.2022.849258. eCollection 2022. Front Physiol. 2022. PMID: 35360246 Free PMC article. Review.
-
Involvement of P2X7 Receptor in Proliferation and Migration of Human Glioma Cells.Biomed Res Int. 2018 Jan 9;2018:8591397. doi: 10.1155/2018/8591397. eCollection 2018. Biomed Res Int. 2018. PMID: 29546069 Free PMC article.
References
-
- Adinolfi E, Capece M, Franceschini A, et al. Accelerated tumor progression in mice lacking the ATP receptor P2X7. Cancer Res 2015; 75:635–44. - PubMed
-
- Partensky C. Toward a better understanding of pancreatic ductal adenocarcinoma: glimmers of hope? Pancreas 2013; 42:729–39. - PubMed
-
- Garrido‐Laguna I, Hidalgo M. Pancreatic cancer: from state‐of‐the‐art treatments to promising novel therapies. Nat Rev Clin Oncol 2015; 12:319–34. - PubMed
MeSH terms
Substances
LinkOut - more resources
Full Text Sources
Other Literature Sources
Medical
Molecular Biology Databases
Miscellaneous

