. 2017 Mar;13(3):236-246.
doi: 10.1016/j.jalz.2016.06.2362. Epub 2016 Aug 8.

Locus coeruleus volume and cell population changes during Alzheimer's disease progression: A stereological study in human postmortem brains with potential implication for early-stage biomarker discovery

Affiliations

Locus coeruleus volume and cell population changes during Alzheimer's disease progression: A stereological study in human postmortem brains with potential implication for early-stage biomarker discovery

Panos Theofilas et al. Alzheimers Dement. 2017 Mar.

Abstract

Introduction: Alzheimer's disease (AD) progression follows a specific spreading pattern, emphasizing the need to characterize those brain areas that degenerate first. The brainstem's locus coeruleus (LC) is the first area to develop neurofibrillary changes (neurofibrillary tangles [NFTs]).

Methods: The methods include unbiased stereological analyses in human brainstems to estimate LC volume and neuronal population in controls and individuals across all AD stages.

Results: As the Braak stage increases by 1 unit, the LC volume decreases by 8.4%. Neuronal loss started only midway through AD progression. Age-related changes spare the LC.

Discussion: The long gap between NFT accumulation and neuronal loss suggests that a second trigger may be necessary to induce neuronal death in AD. Imaging studies should determine whether LC volumetry can replicate the stage-wise atrophy observed here and how these changes are specific to AD. LC volumetry may develop into a screening biomarker for selecting high-yield candidates to undergo expensive and less accessible positron emission tomography scans and to monitor AD progression from presymptomatic stages.

Keywords: Alzheimer's disease; Brainstem; Human; Locus coeruleus; Neurofibrillary tangles; Neuron counts; Postmortem; Unbiased stereology; Volumetry.


Figures

Figure 1
Figure 1
300 μm-thick horizontal histological sections across the locus ceruleus (LC) in a control (Braak and Braak stage 0) subject, stained with gallocyanin (Nissl) (A) and immunostained for tyrosine hydroxylase (TH; B). LC border segmentation on the thick gallocyanin stained is comparable to the TH-immunostained sections and brings the advantage of including the TH-negative neurons. C and D) Volume reconstructions of the human brainstem (glass) and locus ceruleus (LC) in a Braak and Braak stage 0 subject (C) (LC in green), and in a Braak and Braak VI subject (D) (LC in blue). Note the conspicuous atrophy in B. Scale bars: 100 μm.
Figure 2
Figure 2
Plots examining the association between Braak stages and neuronal volumes for the locus ceruleus (LC). Linear regression models indicate a negative correlation between Braak stage and total LC volume (A), with an estimated volume loss of 8.4% per BB stage increment (β = −1.078 with p<0.001 and 95% CI: [−1.6, −0.6]). Furthermore, a significant reduction of partial LC volumes was observed in all three subregions of the nucleus, including the rostral (B; β =−0.436; p=0.001; 95% CI: [−0.7, −0.2]), middle (C; β =− 0.556; p>0.001; 95% CI: [−0.8, −0.2]) , and caudal LC (D; β =− 1.193; p=0.045; 95% CI: [−0.4, −0.0]). The locally weighted regression (lowess) curves assess the local association of LC volumes with Braak stage using a bandwidth of 0.8 in Braak stage. Thus, the values of the lowess curves at Braak stage 0, I, II do not depend on data in Braak stages III–VI.
Figure 3
Figure 3
Gallocyanin-stained neurons of the locus ceruleus (LC) showing a clearly distinct cytoplasm, an off-centered nucleus, and a darkly stained nucleolus, the last used as the counting reference for unbiased stereological analyses of the LC population estimates. The LC includes a collection of large and middle-sized neurons with melanin-pigmentation (stars) as well non-pigmented cells (arrowhead). Scale bar: 10 μm.
Figure 4
Figure 4
Estimated Braak stage-specific rates of change in the locus coeruleus (LC) population counts per Braak stage increase (circles), along with the associated 95% confidence intervals, for total and sub-region LC population sizes. The Braak stage-specific rates of change and associated 95% confidence intervals indicate relatively constant total (A) and partial (B–D) LC population counts in Braak stages 0-II, with the rates of change not being statistically different from 0. On the other hand, the rates of change in stages III–VI are all negative and statistically significant, with an exception of the rostral LC rate (B) of change in stage III that is negative but not statistically significant at the 5% level.
Figure 5
Figure 5
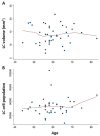
The association of normal aging with total locus ceruleus (LC) volume (A) and population counts (B) among the subjects in Braak stages 0 and I was analyzed using linear regression models. The scatterplots of both LC population counts and volumes versus age indicated that both outcomes varied linearly with age so we fit regression models that included as predictors a linear term for age, as well as Braak stage, gender, and brain weight as potential confounding variables. Our analyses identified no significant changes in the LC volume and population across the age groups.

References

    1. Hurd MD, Martorell P, Langa KM. Monetary costs of dementia in the United States. N Engl J Med. 2013;369:489–490. - PubMed
    1. Iqbal K, Liu F, Gong CX. Alzheimer disease therapeutics: focus on the disease and not just plaques and tangles. Biochem Pharmacol. 2014;88:631–639. - PMC - PubMed
    1. Korczyn AD. Why have we failed to cure Alzheimer’s disease? J Alzheimers Dis. 2012;29:275–282. - PubMed
    1. Duyckaerts C, Delatour B, Potier MC. Classification and basic pathology of Alzheimer disease. Acta Neuropathol. 2009;118:5–36. - PubMed
    1. Andrade-Moraes CH, Oliveira-Pinto AV, Castro-Fonseca E, da Silva CG, Guimaraes DM, Szczupak D, Parente-Bruno DR, Carvalho LR, Polichiso L, Gomes BV, Oliveira LM, Rodriguez RD, Leite RE, Ferretti-Rebustini RE, Jacob-Filho W, Pasqualucci CA, Grinberg LT, Lent R. Cell number changes in Alzheimer’s disease relate to dementia not to plaques and tangles. Brain. 2013;136:3738–3752. - PMC - PubMed