. 2016 Aug 12:6:31450.
doi: 10.1038/srep31450.

Neuroprotective effects of apigenin against inflammation, neuronal excitability and apoptosis in an induced pluripotent stem cell model of Alzheimer's disease

Affiliations

Neuroprotective effects of apigenin against inflammation, neuronal excitability and apoptosis in an induced pluripotent stem cell model of Alzheimer's disease

Rachelle Balez et al. Sci Rep. .

Abstract

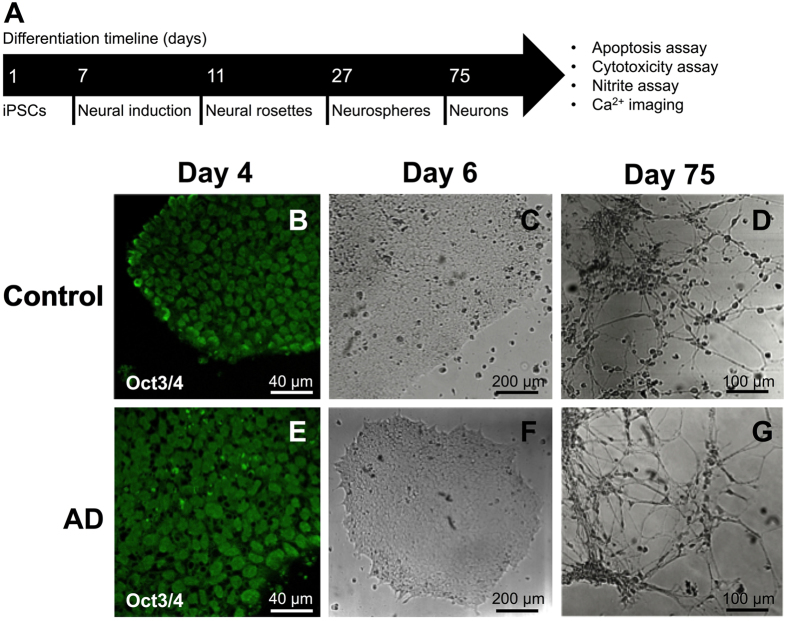
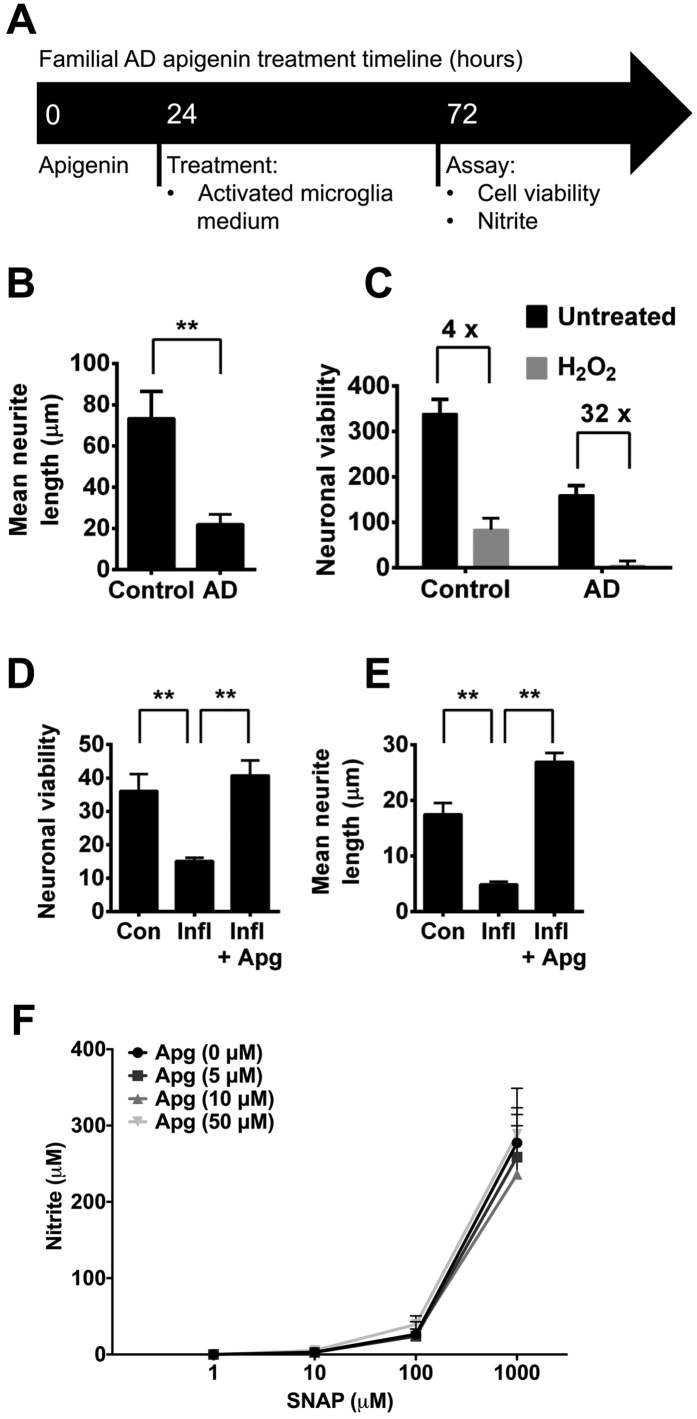
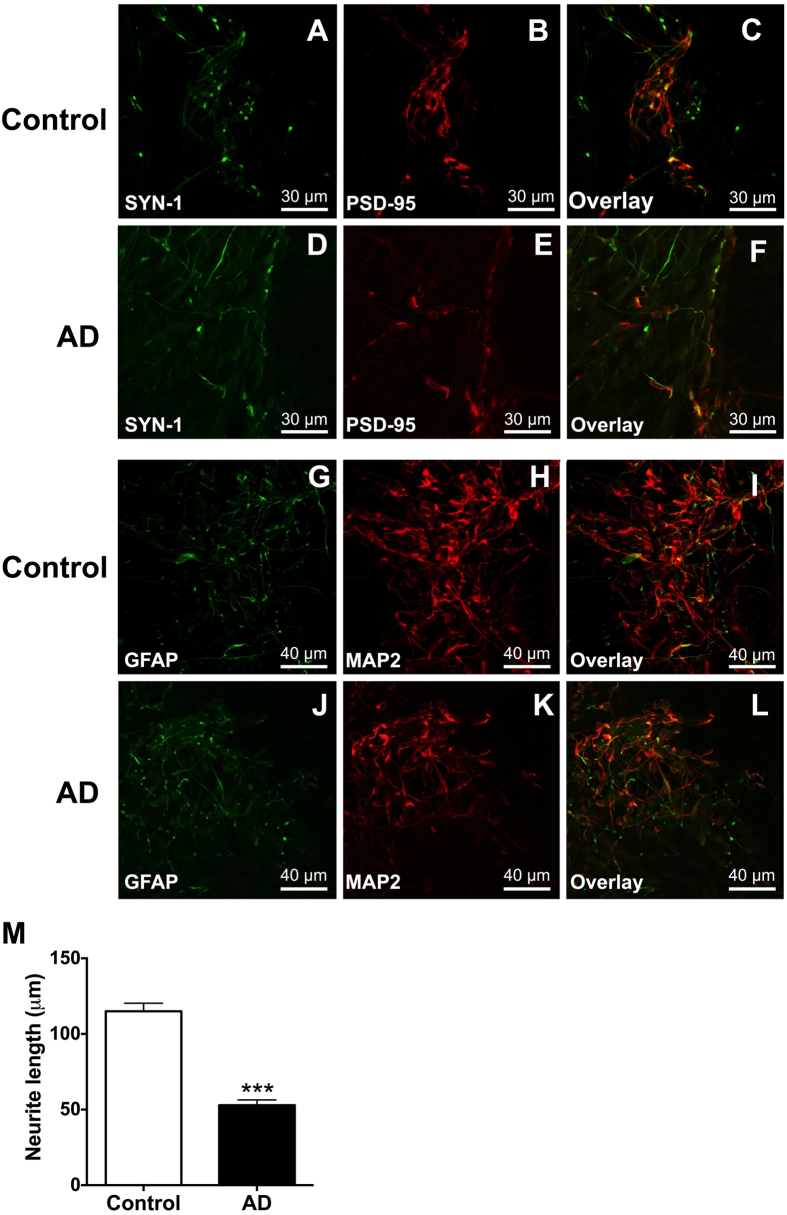
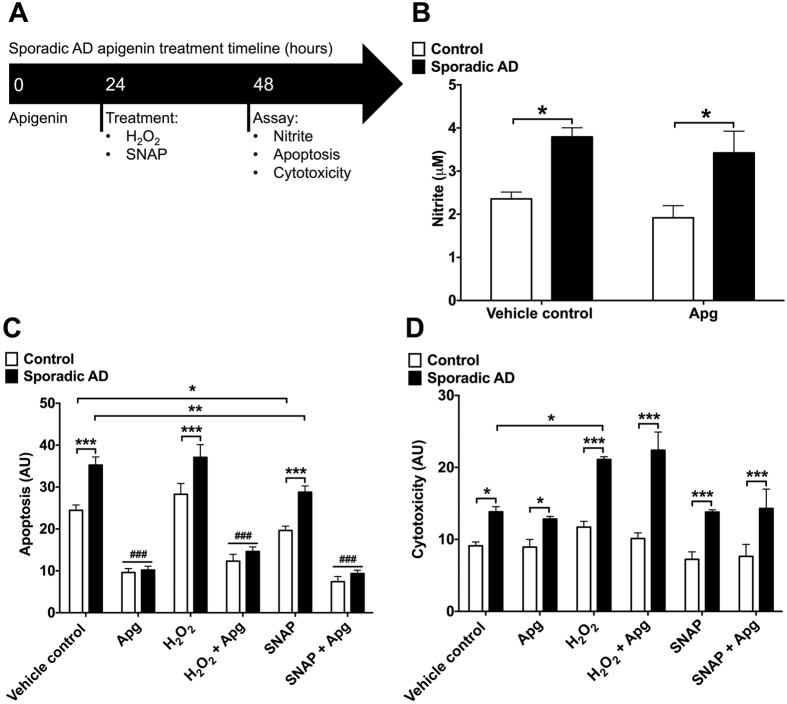
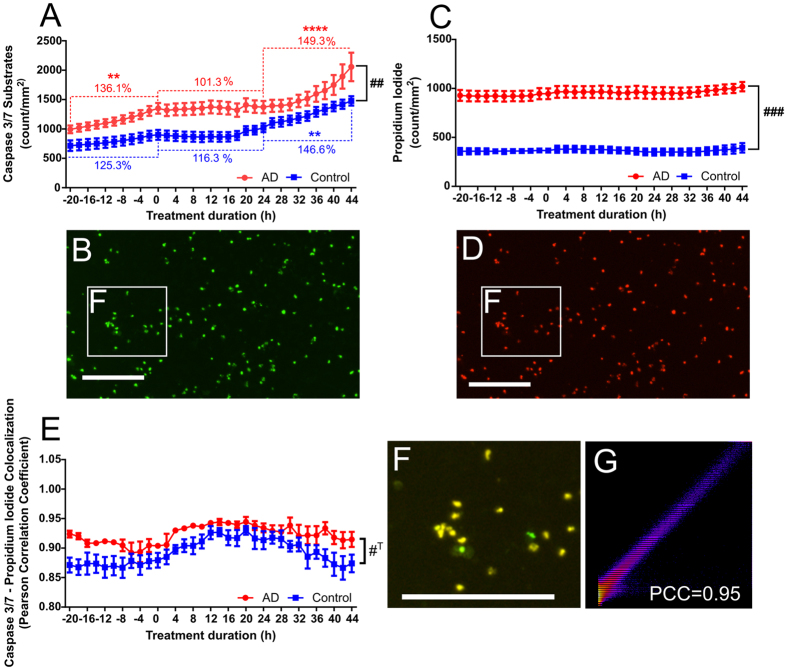
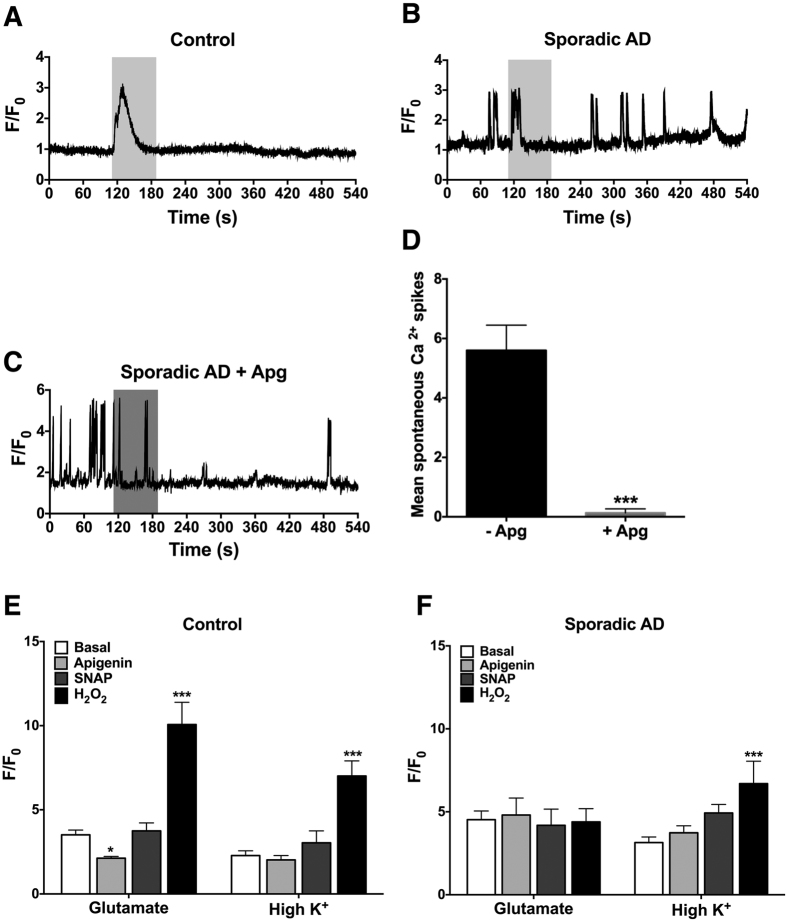
Alzheimer's disease (AD) is one of the most prevalent neurodegenerative diseases, yet current therapeutic treatments are inadequate due to a complex disease pathogenesis. The plant polyphenol apigenin has been shown to have anti-inflammatory and neuroprotective properties in a number of cell and animal models; however a comprehensive assessment has not been performed in a human model of AD. Here we have used a human induced pluripotent stem cell (iPSC) model of familial and sporadic AD, in addition to healthy controls, to assess the neuroprotective activity of apigenin. The iPSC-derived AD neurons demonstrated a hyper-excitable calcium signalling phenotype, elevated levels of nitrite, increased cytotoxicity and apoptosis, reduced neurite length and increased susceptibility to inflammatory stress challenge from activated murine microglia, in comparison to control neurons. We identified that apigenin has potent anti-inflammatory properties with the ability to protect neurites and cell viability by promoting a global down-regulation of cytokine and nitric oxide (NO) release in inflammatory cells. In addition, we show that apigenin is able to protect iPSC-derived AD neurons via multiple means by reducing the frequency of spontaneous Ca(2+) signals and significantly reducing caspase-3/7 mediated apoptosis. These data demonstrate the broad neuroprotective action of apigenin against AD pathogenesis in a human disease model.


Figures

Figure 1
Figure 1
Neuronal differentiation timeline (A) with (BD) control and (EG) AD derived iPSC cells. (B,E) immunostaining of pluripotent stem cell marker Oct3/4, (C,F) brightfield images of stem cell colonies and (D,G), cells after differentiation into neurons.
Figure 2
Figure 2
Apigenin treatment regime for familial AD iPSC-derived neurons (A). Neurons were generated from iPSCs from a familial AD patient carrying a PSEN1 (P117R) mutation or an age-matched control. (B) Length of neurites from familial AD or control neurons was measured using HCA-vision software. All neurites were measured in >10 images per experiment, n = 3. **indicates significant difference (p ≤ 0.01), paired t-test. (C) Neurons were treated with vehicle control or 100 μM H2O2 for 24 h and viability of AD or control neurons was measured. (D) Neuronal viability and (E) neurite length were measured in AD neurons or those cultured in media taken from activated microglia under inflammatory conditions (Infl; microglia activated with LPS (50 μg/ml) and IFN-γ (20 U/ml) for 48 h ± 50 μM Apigenin (Apg; 24 hour pre-incubation). (F) Nitrite formation in cell culture medium in the absence of cells treated with SNAP (0, 1, 10, 100, 1000 μM) and apigenin (0, 5, 10, 50 μM). Data shown are mean ± standard error of the mean from 3 independent experiments.
Figure 3
Figure 3. Neurons were generated from iPSCs from a sporadic AD patient or an age-matched control.
Immunostaining of neurons in culture with (A,D) Synapsin I (SYN-1) and (B,E) PSD-95, (C,F) overlay or (G,J) GFAP and (H,K) MAP2, (I,L) overlay. (M) Length of neurites from sporadic AD or control neurons presented as mean ± SEM of three independent experiments. ***Indicates significant difference (p ≤ 0.001), paired t-test.
Figure 4
Figure 4
(A) Apigenin treatment regime for sporadic AD and control neurons. (B) Nitrite concentration in the cell medium was measured by Griess assay in the presence of vehicle control or apigenin (50 μM treatment for 24 h). (C) Apoptosis and (D) cytotoxicity were simultaneously measured using an Apotox Glo kit. Control or AD neurons were treated with vehicle control or apigenin (50 μM), H2O2 (300 μM) or SNAP (10 μM) for 24 h. Data are presented as mean ± SEM of three independent experiments. Significant differences from matched treatment are indicated by *p ≤ 0.05 and ***p ≤ 0.001, with significant difference from control treatment indicated by ###p ≤ 0.001 using two-way ANOVA with Tukey’s multiple comparisons test.
Figure 5
Figure 5. iPSC-derived neurons were generated from a sporadic AD patient or an age-matched control.
Apoptosis and cell viability were simultaneously assessed after increasing oxygen from 3 to 19% 22 h prior to apigenin (10 μM) treatment. Apoptosis was assessed through quantifying caspase 3/7 substrates (A), number of substrates per mm2, n = 8) % of change between −22 h and 0 h, 0 h and 24 h and 24 h and 44 h indicated through dotted lines. Dead cells were quantified through counting of propidium iodide (C), number of cells per mm2, n = 4). Representative microscopy images of caspase 3/7 substrates (B) and propidium iodide (D) at 10×, scale = 200 μm. (E) Colocalization was determined through Pearson’s correlation coefficient for caspase 3/7 substrate signal with propidium iodide signal (1 = 100% colocalization, 0 = no colocalization). (F) Merged microscopy images of caspase 3/7 and propidium iodide signal at 10×, scale = 200 μm. (G) Representative 2D intensity histogram for green (y-axis, caspase 3/7 substrates) and red (x-axis, propidium iodide signal) pixels. Data presented as mean ± SEM; **p < 0.01, ***p < 0.001, ****p < 0.0001 as compared to % change between 0 h and 24 h time points; #Tp = 0.07, ##p < 0.01, ###p < 0.001 difference between AD and control cultures.
Figure 6
Figure 6
Representative images of Ca2+ imaging traces in (A) control, (B) sporadic AD derived neurons and (C) sporadic AD derived neurons exposed to apigenin. Neurons were loaded with fluorescent Ca2+ indicator Fluo3-AM and data are represented as mean change in fluorescence from baseline (F/F0) over time. Application of 60 mM KCl (high K+) or 50 μM apigenin is represented as the light or dark shaded area, respectively. Mean relative change in fluorescence was calculated from (D) control and (E) sporadic AD derived neurons. Loaded neurons were perfused with 50 μM apigenin, 300 μM H2O2, or 10 μM SNAP prior to 200 μM glutamate or 60 mM high K+. Data are presented as mean ± SEM of three independent experiments from >30 cells. Significant difference from basal response was calculated using two-way ANOVA with Tukey’s multiple comparisons test and is indicated by ***p ≤ 0.001.

References

    1. Reitz C., Brayne C. & Mayeux R. Epidemiology of Alzheimer disease. Nat. Rev. 27, 204–206 (2011). - PMC - PubMed
    1. Poirier J. et al. Apolipoprotein E polymorphism and Alzheimer’s disease. Lancet 342, 697 (1993). - PubMed
    1. Haass C. et al. The Swedish mutation causes early-onset Alzheimer’s disease by [beta]-secretase cleavage within the secretory pathway. Nat Med 1, 1291–1296 (1995). - PubMed
    1. De Strooper B., Iwatsubo T. & Wolfe M. S. Presenilins and -Secretase: Structure, Function, and Role in Alzheimer Disease. Cold Spring Harb. Perspect. Med. 2, a006304–a006304 (2012). - PMC - PubMed
    1. Larson J., Lynch G., Games D. & Seubert P. Alterations in synaptic transmission and long-term potentiation in hippocampal slices from young and aged PDAPP mice. Brain Res . 840, 23–35 (1999). - PubMed

Publication types

MeSH terms