. 2016 Aug 12:7:12471.
doi: 10.1038/ncomms12471.

Fast live-cell conventional fluorophore nanoscopy with ImageJ through super-resolution radial fluctuations

Affiliations

Fast live-cell conventional fluorophore nanoscopy with ImageJ through super-resolution radial fluctuations

Nils Gustafsson et al. Nat Commun. .

Abstract

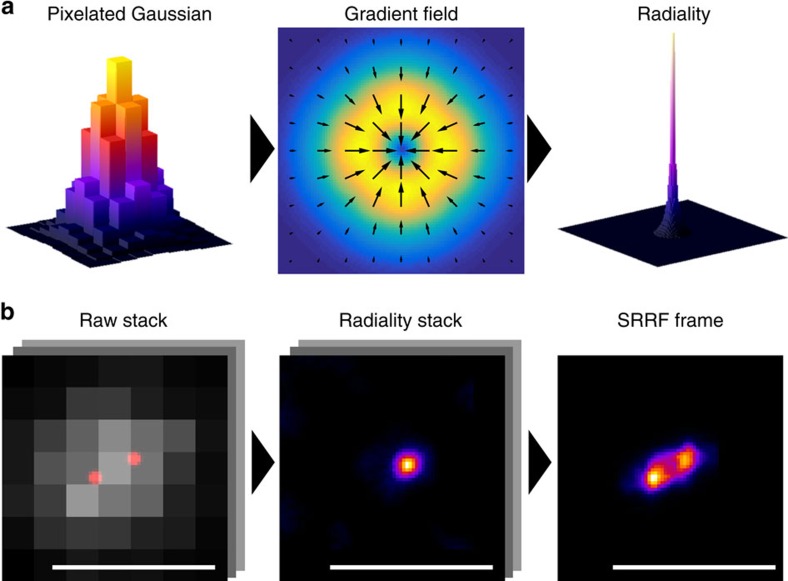
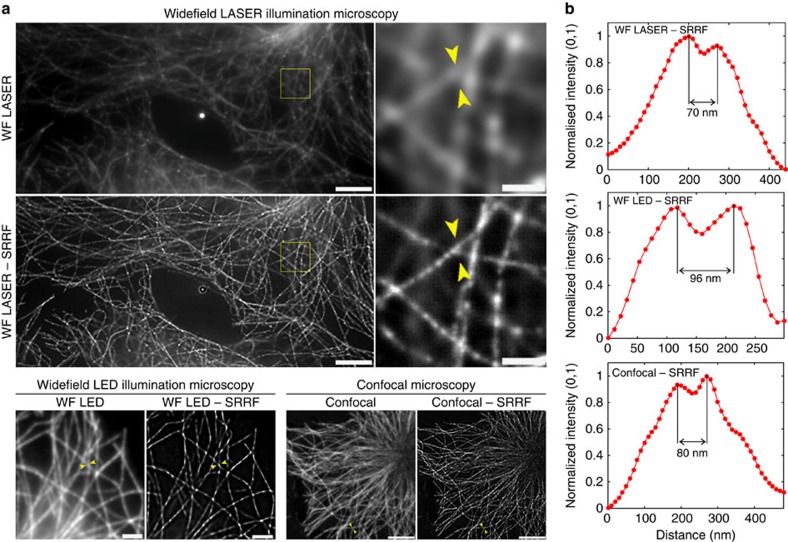
Despite significant progress, high-speed live-cell super-resolution studies remain limited to specialized optical setups, generally requiring intense phototoxic illumination. Here, we describe a new analytical approach, super-resolution radial fluctuations (SRRF), provided as a fast graphics processing unit-enabled ImageJ plugin. In the most challenging data sets for super-resolution, such as those obtained in low-illumination live-cell imaging with GFP, we show that SRRF is generally capable of achieving resolutions better than 150 nm. Meanwhile, for data sets similar to those obtained in PALM or STORM imaging, SRRF achieves resolutions approaching those of standard single-molecule localization analysis. The broad applicability of SRRF and its performance at low signal-to-noise ratios allows super-resolution using modern widefield, confocal or TIRF microscopes with illumination orders of magnitude lower than methods such as PALM, STORM or STED. We demonstrate this by super-resolution live-cell imaging over timescales ranging from minutes to hours.


Figures

Figure 1
Figure 1. The SRRF algorithm.
(a) Spatial analysis. Left: 3D surface plot of a pixelated simulated widefield PSF. Middle: surface plot of the gradient magnitude (arrows indicate direction). Right: 3D surface plot of the measured radiality PSF. (b) Temporal analysis. Left: a 100 frame simulation of a pair of fluctuating fluorophores separated by the sigma (σ) of the widefield PSF (135 nm). The true fluorophore positions are indicated in red and the pixelated simulated noisy intensity distribution is shown in grey. Middle: stack of radiality maps obtained by applying radiality to each image in the simulated image sequence. Right: SRRF image acquired by higher-order temporal analysis of the stack of radiality maps. Scale bar, 500 nm.
Figure 2
Figure 2. SRRF applied from low- to ultra-high-fluorophore densities on simulated and experimental data.
(a) Simulations of multiple densities of emitting fluorophores, mean nearest neighbour distance <dNN>, and number of frames shown underneath equivalent images. Ground truth consists of two diverging lines separated by 0 nm (top) through to 350 nm (bottom) with fluorophores placed every 5 nm along the lines (further simulation parameters described in the ‘Methods' section). Left: ground truth, equivalent diffraction limited image and representative single-simulated frames. Middle: reconstructions from SRRF. Right: reconstructions from multi-emitter fitting with maximum-likelihood estimation. Yellow arrows on SRRF reconstructions indicate point at which filaments are no longer resolved (from left to right 30, 50, 100, 110 and 140 nm). Scale bars, 500 nm. (b) Fixed microtubules labelled with Alexa Fluor 647, imaged with different laser intensities to produce different length data sets of varying fluorophore densities. Number of frames in data set, on-sample laser intensity and total acquisition time shown underneath images. The same region of the sample was imaged under each set of conditions. Far left: TIRF image of region. Left: representative single frames from acquired data sets. Middle: reconstructions from SRRF. Right: reconstructions from multi-emitter fitting with maximum likelihood estimation. Scale bars, 500 nm.
Figure 3
Figure 3. SRRF applied to widefield laser and LED illumination microscopy and confocal microscopy.
(a) Widefield laser-illuminated image and SRRF reconstruction of a fixed cell with Alexa Fluor 647-labelled microtubules following dSTORM acquisition (scale bar 5 μm) and expanded view of the yellow-boxed region (scale bar, 1 μm); widefield LED-illuminated image and SRRF reconstruction of Alexa Fluor 647-labelled microtubules (scale bar, 2 μm); confocal image and SRRF reconstruction of Alexa Fluor 647-labelled microtubules (scale bar, 5 μm). (b) Normalized line profiles taken from the regions between the yellow arrowheads for corresponding SRRF images in a showing separated features.
Figure 4
Figure 4. SRRF used for super-resolution live-imaging of Jurkat T cells transiently expressing LifeAct-GFP.
(a) Conventional TIRF microscopy (TIRF) versus SRRF images (SRRF) of Jurkat T cells transfected with LifeAct-GFP dropped on an anti-CD3-coated coverslip and imaged for 180 s at 1 super-resolution f.p.s. (b) Conventional TIRF and SRRF images of Jurkat T cells expressing LifeAct-GFP imaged on coverslips coated with anti-CD28 alone, anti-CD3 alone or in combination (anti-CD3 and -CD28) to stimulate an immunological synapse formation (highlighted area corresponds to the region used for PIV analysis). (c) PIV analysis of corresponding Supplementary Movies 6–8 shows notable retrograde actin flow in anti-CD3 but not in anti-CD28 stimulated Jurkat T cells. A colour-coded measure of flow directionality and speed is plotted for the blue highlighted regions. White arrows in colour wheel are representative of flow direction, central colour (minimum intensity) corresponds to 0 μm min−1, saturated colours (maximum intensity) correspond to 38.4 μm min−1. Scale bars, 5 μm.

References

    1. Betzig E. et al.. Imaging intracellular fluorescent proteins at nanometer resolution. Science 313, 1642–1645 (2006). - PubMed
    1. Rust M. J., Bates M. & Zhuang X. Sub-diffraction-limit imaging by stochastic optical reconstruction microscopy (STORM). Nat. Methods 3, 793–795 (2006). - PMC - PubMed
    1. Gustafsson M. G. Surpassing the lateral resolution limit by a factor of two using structured illumination microscopy. J. Microsc. 198, 82–87 (2000). - PubMed
    1. Huang B., Bates M. & Zhuang X. Super-resolution fluorescence microscopy. Annu. Rev. Biochem. 78, 993–1016 (2009). - PMC - PubMed
    1. Sauer M. Localization microscopy coming of age: from concepts to biological impact. J. Cell Sci. 126, 3505–3513 (2013). - PubMed