

Performance of genomic prediction within and across generations in maritime pine
- PMID: 27515254
- PMCID: PMC4981999
- DOI: 10.1186/s12864-016-2879-8
Performance of genomic prediction within and across generations in maritime pine
Abstract
Background: Genomic selection (GS) is a promising approach for decreasing breeding cycle length in forest trees. Assessment of progeny performance and of the prediction accuracy of GS models over generations is therefore a key issue.
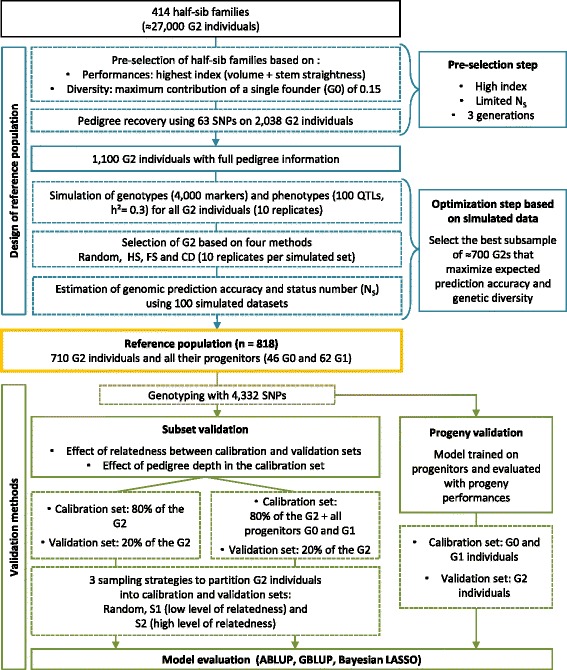
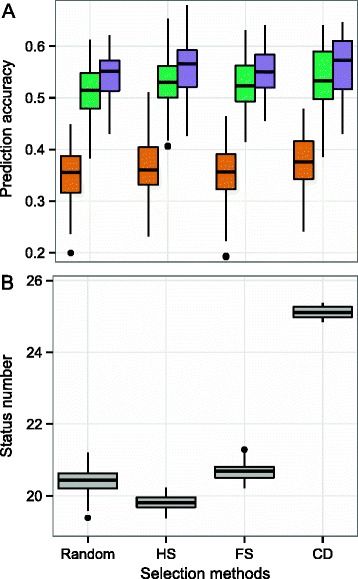
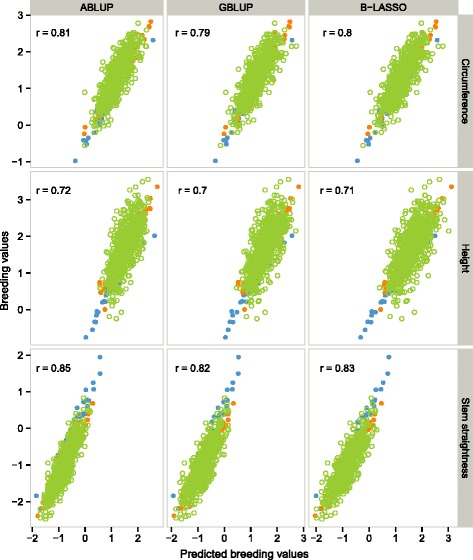
Results: A reference population of maritime pine (Pinus pinaster) with an estimated effective inbreeding population size (status number) of 25 was first selected with simulated data. This reference population (n = 818) covered three generations (G0, G1 and G2) and was genotyped with 4436 single-nucleotide polymorphism (SNP) markers. We evaluated the effects on prediction accuracy of both the relatedness between the calibration and validation sets and validation on the basis of progeny performance. Pedigree-based (best linear unbiased prediction, ABLUP) and marker-based (genomic BLUP and Bayesian LASSO) models were used to predict breeding values for three different traits: circumference, height and stem straightness. On average, the ABLUP model outperformed genomic prediction models, with a maximum difference in prediction accuracies of 0.12, depending on the trait and the validation method. A mean difference in prediction accuracy of 0.17 was found between validation methods differing in terms of relatedness. Including the progenitors in the calibration set reduced this difference in prediction accuracy to 0.03. When only genotypes from the G0 and G1 generations were used in the calibration set and genotypes from G2 were used in the validation set (progeny validation), prediction accuracies ranged from 0.70 to 0.85.
Conclusions: This study suggests that the training of prediction models on parental populations can predict the genetic merit of the progeny with high accuracy: an encouraging result for the implementation of GS in the maritime pine breeding program.
Keywords: Genomic selection; Growth; Multiple generations; Pinus pinaster; Progeny validation; Relatedness; Stem straightness.
Figures
References
-
- Heffner EL, Lorenz AJ, Jannink J-L, Sorrells ME. Plant breeding with genomic selection: gain per unit time and cost. Crop. Sci. 2010;50(5):1681–90. doi: 10.2135/cropsci2009.11.0662. - DOI
-
- Bernardo R, Yu J. Prospects for genomewide selection for quantitative traits in Maize. Crop. Sci. 2007;47(3):1082–90. doi: 10.2135/cropsci2006.11.0690. - DOI
-
- Thomson MJ. High-throughput SNP genotyping to accelerate crop improvement. Plant Breed Biotechnol. 2014;2(3):195–212. doi: 10.9787/PBB.2014.2.3.195. - DOI
Publication types
MeSH terms
Substances
LinkOut - more resources
Full Text Sources
Other Literature Sources
