. 2016 Aug 12:7:12157.
doi: 10.1038/ncomms12157.

Analysis of cancer genomes reveals basic features of human aging and its role in cancer development

Affiliations

Analysis of cancer genomes reveals basic features of human aging and its role in cancer development

Dmitriy I Podolskiy et al. Nat Commun. .

Abstract

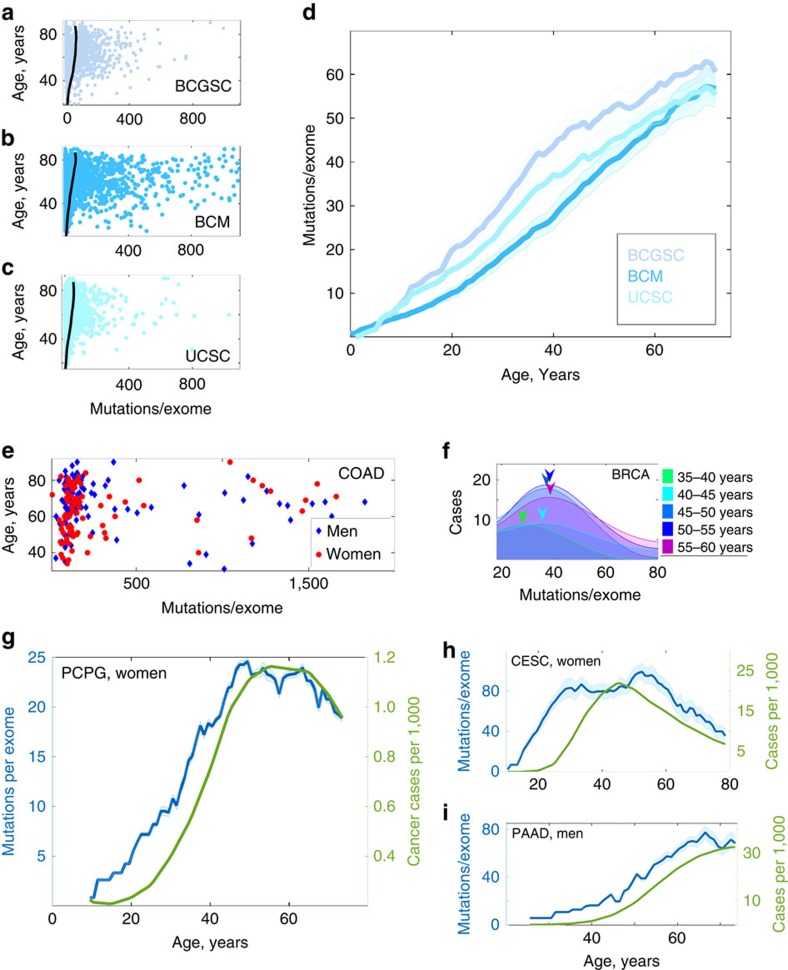
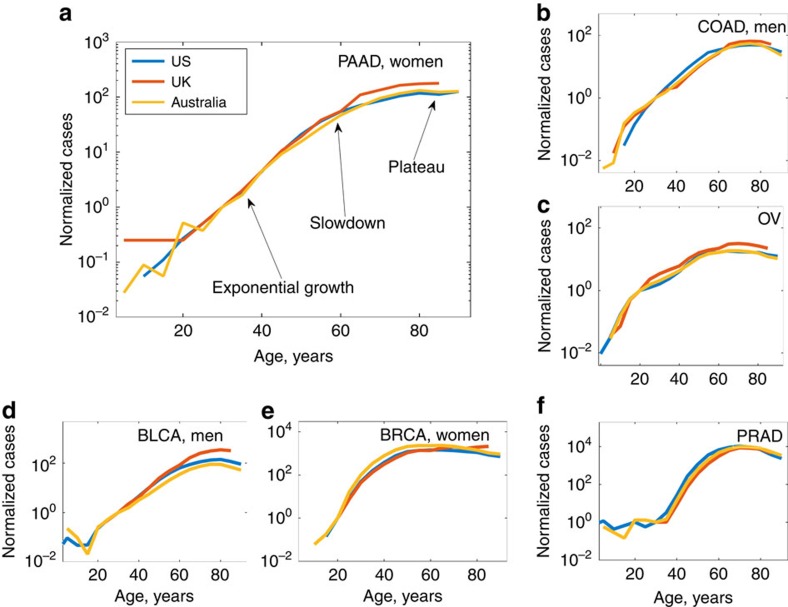
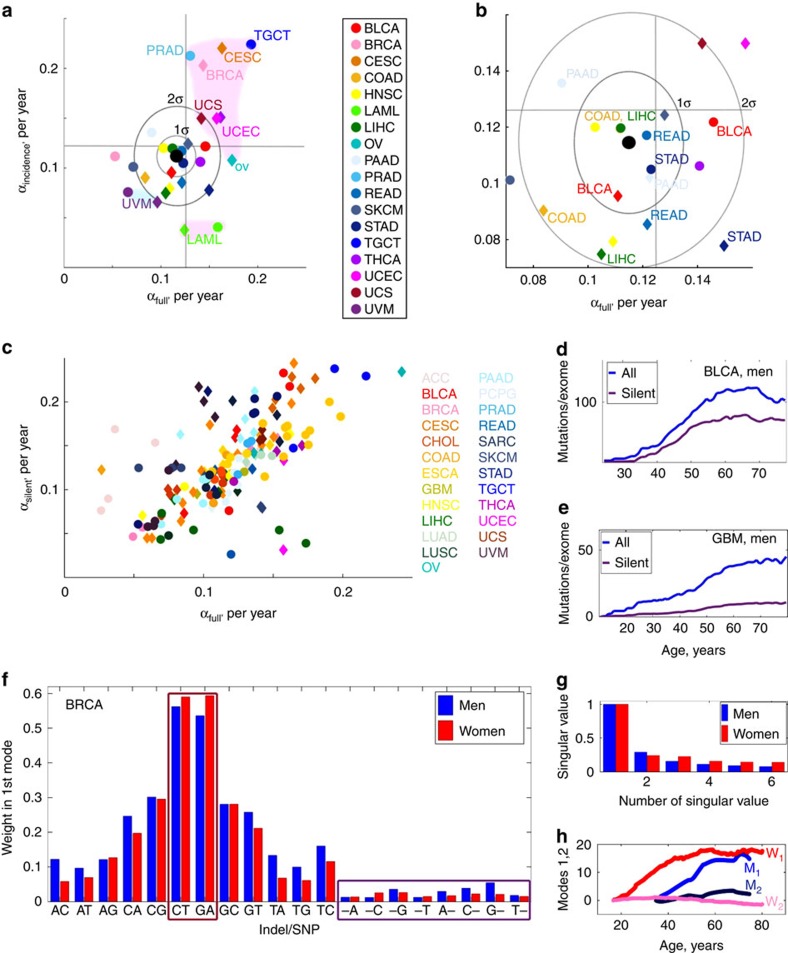
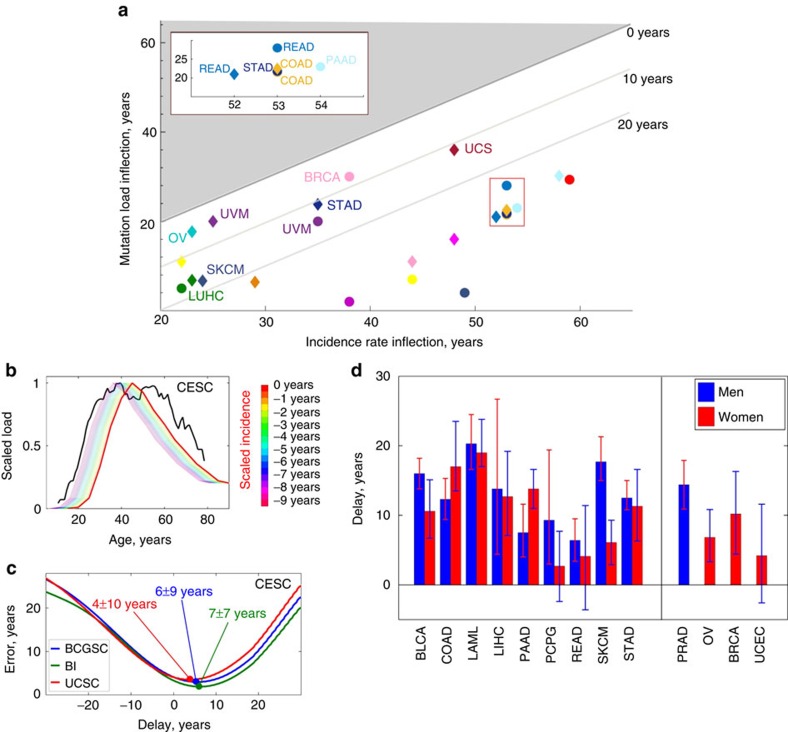
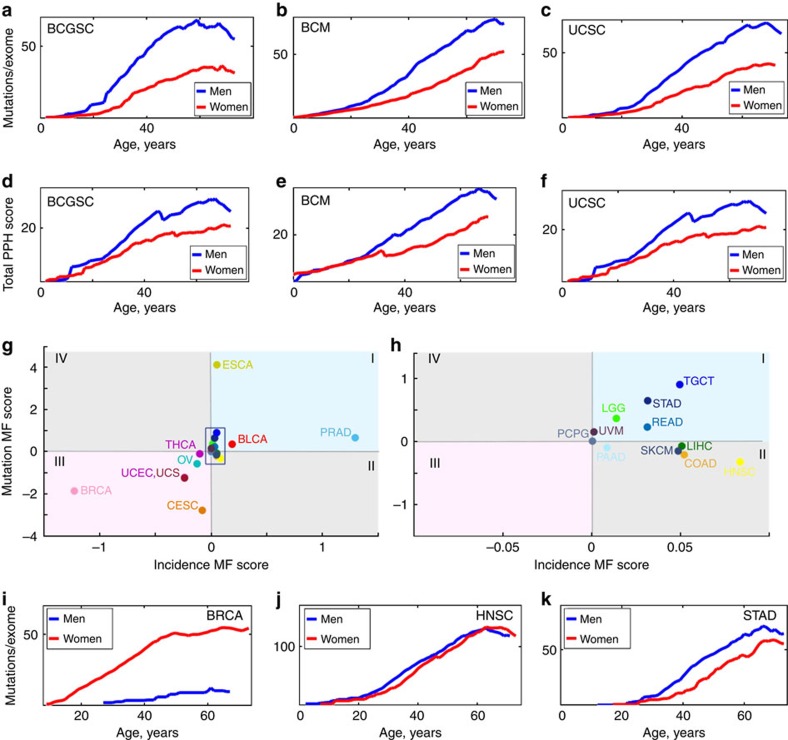
Somatic mutations have long been implicated in aging and disease, but their impact on fitness and function is difficult to assess. Here by analysing human cancer genomes we identify mutational patterns associated with aging. Our analyses suggest that age-associated mutation load and burden double approximately every 8 years, similar to the all-cause mortality doubling time. This analysis further reveals variance in the rate of aging among different human tissues, for example, slightly accelerated aging of the reproductive system. Age-adjusted mutation load and burden correlate with the corresponding cancer incidence and precede it on average by 15 years, pointing to pre-clinical cancer development times. Behaviour of mutation load also exhibits gender differences and late-life reversals, explaining some gender-specific and late-life patterns in cancer incidence rates. Overall, this study characterizes some features of human aging and offers a mechanism for age being a risk factor for the onset of cancer.


Figures

Figure 1
Figure 1. Accumulation of mutations with age and cancer incidence.
(a) Somatic mutation distribution and combined mutation load for gender-nonspecific cancers (ESCA, LIHC, PAAD, PCPG, SARC, STAD and UVM in both men and women) sequenced by Canada's Michael Smith Genome Sciences Centre (BCGSC). Each point represents a particular cancer sample. Black line denotes behaviour of the median of the distribution with age. (b) The same for samples sequenced by Baylor College of Medicine (BCM); cancers include ESCA, LIHC, LGG, PAAD, PCPG, STAD, THCA and UVM. (c) The same for samples sequenced by the University of California-Santa Cruz (UCSC); cancers include ESCA, KIRP, LIHC, PAAD, PCPG, SARC and UVM. (d) Behaviour of the mutation load distribution medians with age for distributions depicted in ac. (e) Mutation load distribution for patients with colon adenocarcinoma (COAD), samples sequenced by BCM, IlluminaGA pipeline. Cancers in men are shown in blue, and in women in red. (f) Dynamics of the mutation load distribution P(N, t) of somatic mutation counts N with age t for breast adenocarcinoma (BRCA) in women. Samples sequenced by Washington University, IlluminaGA human-curated pipeline. The actual histograms of mutation loads are approximated by 8 degree polynomials. For each age cohort, the distribution peak is denoted by a coloured arrow. (g) Somatic mutation load versus cancer incidence (cases per 1,000 capita) for pheochromocytoma and paraganglioma (PCPG) cancers in women; samples sequenced by Broad Institute, IlluminaGA automated variant-calling pipeline. Cancer incidences (green) and age-related somatic mutation accumulation pattern (blue). (h) The same for cervical squamous cell carcinoma and endocervical adenocarcinoma (CESC). Samples sequenced by BCGSC, IlluminaHiSeq automated pipeline. (i) The same for pancreatic adenocarcinoma (PAAD) in men. Samples sequenced by BCM, IlluminaGA automated pipeline. Results for other cancers, datacenters and variant-calling pipelines are presented in Supplementary Figs 1–16. Errors are s.d., calculated using bootstrapping as described in Methods.
Figure 2
Figure 2. Behaviour of cancer incidence with age.
Incidence patterns are normalized for unit incidence at age 30 years and presented in semi-log scale. A typical incidence pattern is characterized by exponential increase at early ages, subsequent slowdown and plateau/decreased incidence in late life. The doubling rates of cancer incidence (linear rates of incidence growth in semi-log scale) and the ages of incidence slowdown/plateau are the same for cancer incidences in all three countries. Standard cancer incidences (cases per 100,000 people) are presented in ‘Growth of cancer incidence with age for different countries' in Supplementary Information. (a) Pancreatic cancer in women. (b) Colon cancer in men. (c) Ovarian cancer. (d) Bladder adenocarcinoma in men. (e) Breast cancer in women. (f) Prostate cancer.
Figure 3
Figure 3. Mutation accumulation doubling rates and mutational patterns.
(a) Somatic mutation accumulation doubling rate αfull versus cancer incidence rate doubling rate αincidence for different cancer types. Cancers in men are denoted by circles, and cancers in women by diamonds according to the colour scheme on the right. A black spot is an average of rates over all cancers. Grey ovals are the contours of the 1σ and 2σ deviations from the average. Straight grey lines correspond to the human mortality doubling rate of 0.125 per year. Pinkish clouds correspond to cancers representing reproductive tissues (upper) and leukaemia (lower). The blue cloud represents cancer of the uvea. (b) Magnification of a showing cancers within the 1σ, 2σ areas. (c) Somatic mutation accumulation doubling rate αfull versus doubling rate αsilent for accumulation of silent mutations for different cancer types (gender-specific data combined). Points of the same colour correspond to the data sets representing the same cancer type, sequenced by different datacenters using different variant-calling pipelines. (d) Full average counts of somatic mutations per exome versus silent mutations for bladder urothelial carcinoma (BLCA) in men. Samples sequenced by Broad Institute, IlluminaGA pipeline. (e) The same for glioblastoma multiforme (GBM) in men. Samples sequenced by Broad Institute, IlluminaGA pipeline. (f) Identifying age-dependent mutational signatures for the breast invasive carcinoma (BRCA) data set. Samples sequenced by Washington University School of Medicine, IlluminaGA human-curated pipeline. Relative weights of different mutation types in the first mutational signature. The signature is dominated by CT and GA mutations (dark red rectangle), the contribution of simple indels is subdominant (violet rectangle). (g) Relative weights of the first six signatures, normalized to 1; the first signature dominates, corresponding to the pattern of somatic mutation accumulation associated with aging. (h) Behaviour of projections onto the first and second leading mutational signatures with age.
Figure 4
Figure 4. Lags between cancer incidence and mutation accumulation.
(a) Inflection points in cancer incidence versus inflection points in somatic mutation accumulation. Bounds corresponding to 0, 10 and 20 year delays in cancer incidence versus mutation accumulation are shown, and the select cancers are labelled. The red rectangle is amplified in the inset. The area coloured in grey corresponds to the situation when mutation load inflection occurs later than incidence inflection; no cancers were found to belong to this region. (b) Identifying the delay between reported cancer incidence and somatic mutation accumulation for cervical cell carcinoma and endocervical adenocarcinoma (CESC). Samples sequenced by BCGSC, IlluminaGA pipeline. The cancer incidence (red) and somatic mutation accumulation (black) curves are renormalized to the same scale, then the incidence curve is displaced until the Euclidean distance functional between the two curves reaches its minimum. (c) Behaviour of time delay estimation error for data sets produced by BCGSC (blue), BI (green) and UCSC (red), cervical cell carcinoma and endocervical adenocarcinoma (CESC). The estimated time delay between cancer incidence and somatic mutation accumulation patterns corresponds to the minimum of the error (denoted by blobs). (d) Estimated time delays between cancer incidence and somatic mutation accumulation patterns for non-gender-specific (left) and gender-specific (right) cancers. For every cancer type, averaging over estimates based on the results by different datacenters/pipelines was performed. Red bars correspond to women, and blue to men. Errors are s.d., calculated using bootstrapping as described in Methods.
Figure 5
Figure 5. Gender effects in the behaviour of mutation load and burden.
(a) Total mutation load for combined non-gender-specific cancers (ESCA, LIHC, PAAD, PCPG, SARC, STAD and UVM) sequenced by BCGSC, IlluminaHiSeq automated pipeline. The data in men are shown in blue and in women in red. (b) The same for cancers (ESCA, LIHC, LGG, PAAD, PCPG, STAD, THCA and UVM) sequenced by BCM, IlluminaGA automated pipeline. (c) The same for cancers (ESCA, KIRP, LIHC, PAAD, PCPG, SARC and UVM) sequenced by UCSC, IlluminaGA automated pipeline. (df) Total mutation burdens for the same combinations of cancers, sequencing centres and pipelines as in ac. Values of mutation burden were estimated using PolyPhen2 (ref. 55). (g) The MF (Male—Female) scores of mutation accumulation rates versus cancer incidence rates characterizing differences in mutation load between men and women. The blue area on the plots corresponds to cancers with higher overall mutation load in men than in women, and the pink area to cancers with lower overall mutation load in men than in women. (h) The area in rectangle in g is amplified and cancers indicated. (ik) Examples of gender-specific mutation load behaviour of several cancer types. (i) Breast invasive carcinoma (BRCA). Samples sequenced by WUSM using IlluminaGA human-curated pipeline. Mutation load in men is significantly lower than mutation load in women for all ages. (j) Head and neck squamous cell carcinoma (HNSC). Samples sequenced by BI using IlluminaGA automated pipeline. Mutation load in men and women is approximately the same for all ages. (k) Stomach adenocarcinoma (STAD), samples sequenced by BCM using IlluminaGA automated pipeline. Mutation load in men is higher than in women for all ages.

References

    1. Sanders S. J. et al.. De novo mutations revealed by whole-exome sequencing are strongly associated with autism. Nature 485, 237–241 (2012). - PMC - PubMed
    1. Neale B. M. et al.. Patterns and rates of exonic de novo mutations in autism spectrum disorders. Nature 485, 242–245 (2012). - PMC - PubMed
    1. O'Roak B. J. et al.. Sporadic autism exomes reveal a highly interconnected protein network of de novo mutations. Nature 485, 246–250 (2012). - PMC - PubMed
    1. Kong A. et al.. Rate of de novo mutations and the importance of father's age to disease risk. Nature 488, 471–475 (2012). - PMC - PubMed
    1. Bender A. et al.. High levels of mitochondrial DNA deletions in substantia nigra neurons in aging and Parkinson disease. Nat. Genet. 38, 515–517 (2006). - PubMed

Publication types