. 2016 Dec 1;32(23):3552-3558.
doi: 10.1093/bioinformatics/btw524. Epub 2016 Aug 11.

Multivariate Welch t-test on distances

Affiliations

Multivariate Welch t-test on distances

Alexander V Alekseyenko. Bioinformatics. .

Abstract

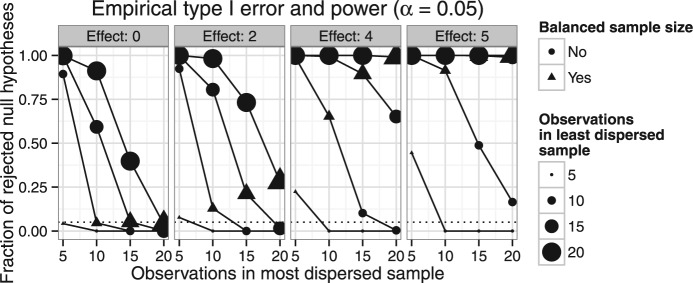
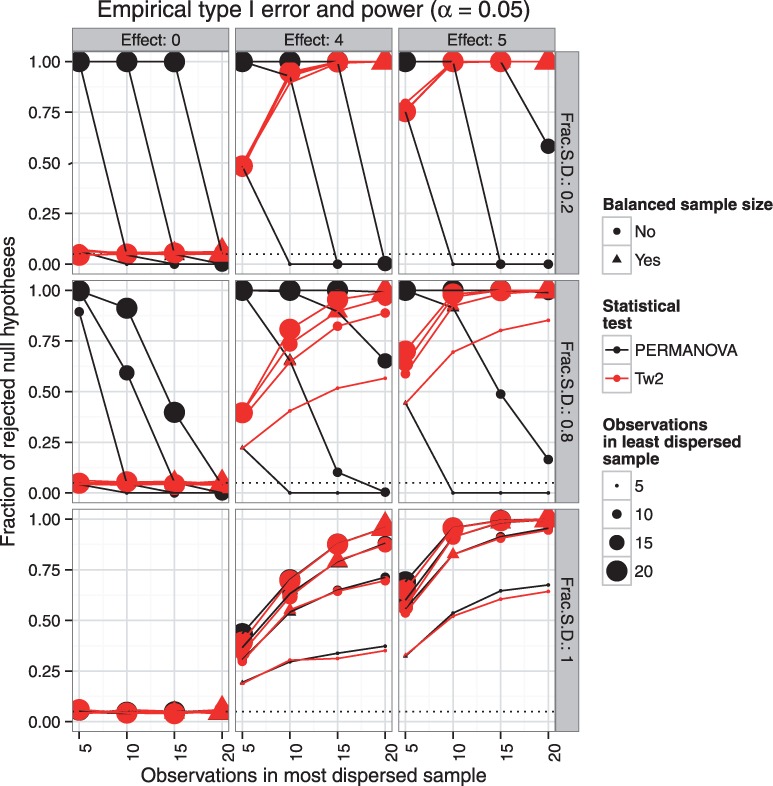
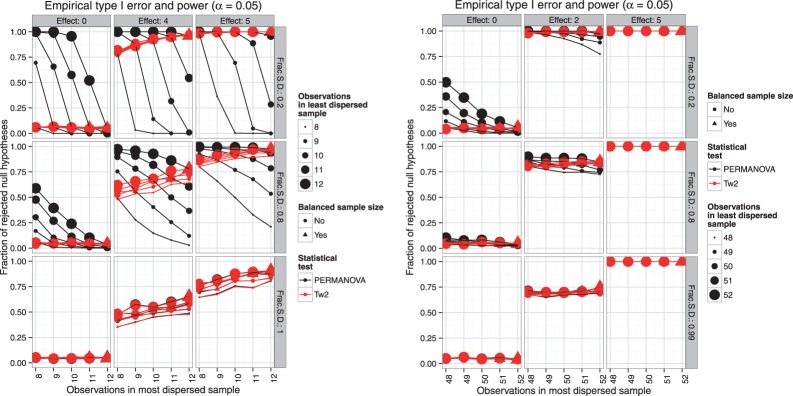
Motivation: Permutational non-Euclidean analysis of variance, PERMANOVA, is routinely used in exploratory analysis of multivariate datasets to draw conclusions about the significance of patterns visualized through dimension reduction. This method recognizes that pairwise distance matrix between observations is sufficient to compute within and between group sums of squares necessary to form the (pseudo) F statistic. Moreover, not only Euclidean, but arbitrary distances can be used. This method, however, suffers from loss of power and type I error inflation in the presence of heteroscedasticity and sample size imbalances.

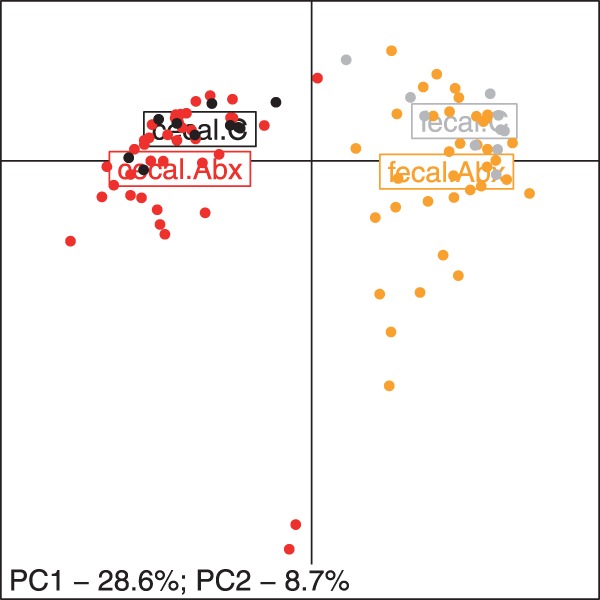
Results: We develop a solution in the form of a distance-based Welch t-test, [Formula: see text], for two sample potentially unbalanced and heteroscedastic data. We demonstrate empirically the desirable type I error and power characteristics of the new test. We compare the performance of PERMANOVA and [Formula: see text] in reanalysis of two existing microbiome datasets, where the methodology has originated.

Availability and implementation: The source code for methods and analysis of this article is available at https://github.com/alekseyenko/Tw2 Further guidance on application of these methods can be obtained from the author.

Contact: alekseye@musc.edu.


Figures

Fig. 1.
Fig. 1.
Type I error and power characteristics of the PERMANOVA test with potentially unequal sample sizes. The headers of the boxes indicate the simulated effect size 0 (where type I error rate is determined), 2, 4 and 5. The size of the points corresponds to the number of observations in the least dispersed sample. Points, where the sample sizes are balanced, are indicated by triangles. Plot of a method with ideal type I error characteristics (left box) will be a horizontal line at the significance threshold α = 0.05. When effect size is greater than 0, the plots show the power characteristics. Plot of a method with ideal power will be a horizontal line at 1.0, corresponding to perfect power and no type II error
Fig. 2.
Fig. 2.
Empirical type I error and power characteristics of PERMANOVA (black) and TW2 (red). The effect sizes vary in columns of panels. Effect size 0 corresponds to the case where the null hypothesis is true and the plots demonstrate the type I error. Plot of a method with ideal type I error characteristics will be a horizontal line at the significance threshold α = 0.05. When effect size is greater than 0, the plots show the power characteristics. Plot of a method with ideal power will be a horizontal line at 1.0, corresponding to perfect power and no type II error. The degree of heteroscedasticity varies along the rows and is represented in terms of ratio of the standard deviations (Frac SD) between two samples. The bottom row corresponds to homoscedastic scenario, the top and middle rows show high and medium heteroscedasticity scenarios, respectively. The number of observations in the least dispersed sample is indicated by the size of the point and the balanced samples are identified by triangles
Fig. 3.
Fig. 3.
Empirical type I error and power characteristics of PERMANOVA (black) and TW2 (red) tests with varying effect size, degree of heteroscedasticity and number of observations in two samples, for sample sizes typical for (a) a discovery study or (b) a small clinical study. The effect sizes vary in columns of panels. Effect size 0 corresponds to the case where the null hypothesis is true and the plots demonstrate the type I error. Plot of a method with ideal type I error characteristics will be a horizontal line at the significance threshold α = 0.05. When effect size is greater than 0, the plots show the power characteristics. Plot of a method with ideal power will be a horizontal line at 1.0, corresponding to perfect power and no type II error. The degree of heteroscedasticity varies along the rows and is represented in terms of ratio of the standard deviations (Frac SD) between two samples. The bottom row corresponds to homoscedastic scenario, the top and middle rows show high and medium heteroscedasticity scenarios, respectively. The number of observations in the least dispersed sample is indicated by the size of the point and the balanced samples are identified by triangles
Fig. 4.
Fig. 4.
Principal coordinates analysis of sub-therapeutic antibiotic treatment data. Points correspond to the individual observations in cecal control (black), cecal antibiotics (red), fecal control (gray), and fecal antibiotic (orange) groups. The centroid of each group is marked by the box with the group labels

References

    1. Alekseyenko A.V. et al. (2013) Community differentiation of the cutaneous microbiota in psoriasis. Microbiome, 1, 1–17. - PMC - PubMed
    1. Anderson M.J. (2001) A new method for non-parametric multivariate analysis of variance. Aust. Ecol., 26, 32–46.
    1. Anderson M.J. (2006) Distance-based tests for homogeneity of multivariate dispersions. Biometrics, 62, 245–253. - PubMed
    1. Anderson M.J. et al. (2006) Multivariate dispersion as a measure of beta diversity. Ecol. Lett., 9, 683–693. - PubMed
    1. Cho I. et al., (2012) Antibiotics in early life alter the murine colonic microbiome and adiposity. Nature, 621–626. - PMC - PubMed