. 2016 Aug 11;16(1):405.
doi: 10.1186/s12879-016-1716-7.

Mortality and transmissibility patterns of the 1957 influenza pandemic in Maricopa County, Arizona

Affiliations

Mortality and transmissibility patterns of the 1957 influenza pandemic in Maricopa County, Arizona

April J Cobos et al. BMC Infect Dis. .

Abstract

Background: While prior studies have quantified the mortality burden of the 1957 H2N2 influenza pandemic at broad geographic regions in the United States, little is known about the pandemic impact at a local level. Here we focus on analyzing the transmissibility and mortality burden of this pandemic in Arizona, a setting where the dry climate was promoted as reducing respiratory illness transmission yet tuberculosis prevalence was high.

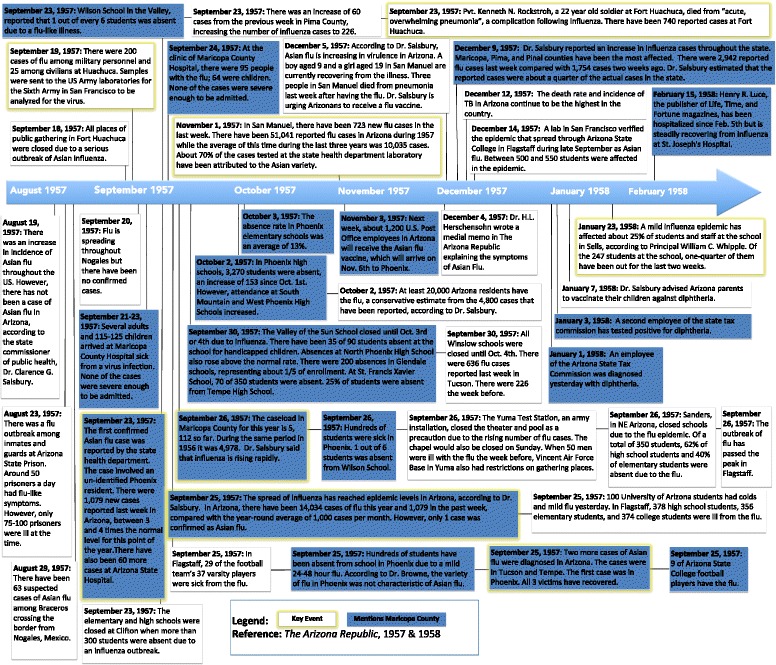
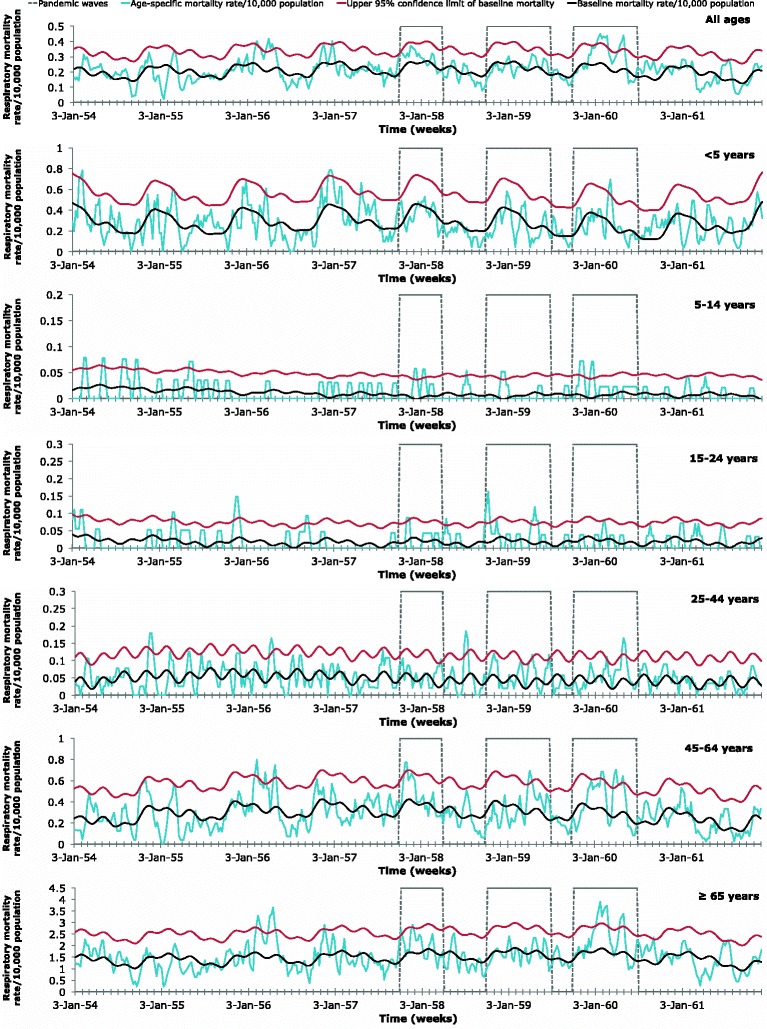
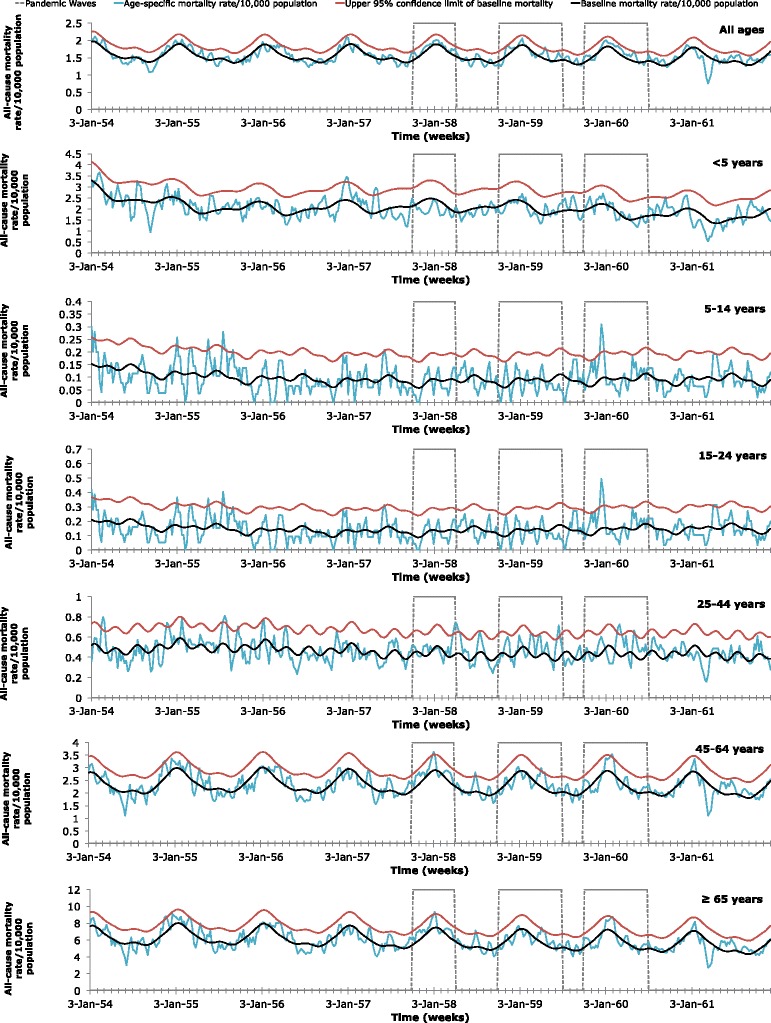
Methods: Using archival death certificates from 1954 to 1961, we quantified the age-specific seasonal patterns, excess-mortality rates, and transmissibility patterns of the 1957 H2N2 pandemic in Maricopa County, Arizona. By applying cyclical Serfling linear regression models to weekly mortality rates, the excess-mortality rates due to respiratory and all-causes were estimated for each age group during the pandemic period. The reproduction number was quantified from weekly data using a simple growth rate method and assumed generation intervals of 3 and 4 days. Local newspaper articles published during 1957-1958 were also examined.

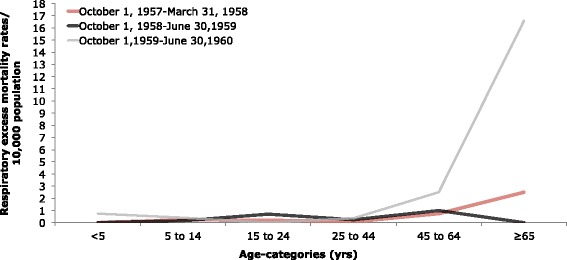
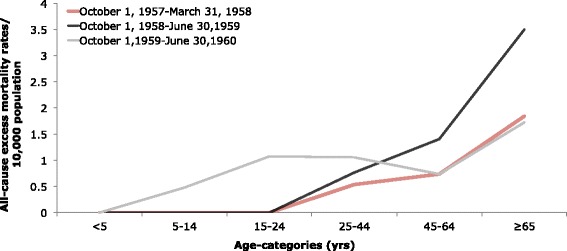
Results: Excess-mortality rates varied between waves, age groups, and causes of death, but overall remained low. From October 1959-June 1960, the most severe wave of the pandemic, the absolute excess-mortality rate based on respiratory deaths per 10,000 population was 16.59 in the elderly (≥65 years). All other age groups exhibit very low excess-mortality and the typical U-shaped age-pattern was absent. However, the standardized mortality ratio was greatest (4.06) among children and young adolescents (5-14 years) from October 1957-March 1958, based on mortality rates of respiratory deaths. Transmissibility was greatest during the same 1957-1958 period, when the mean reproduction number was estimated at 1.08-1.11, assuming 3- or 4-day generation intervals with exponential or fixed distributions.

Conclusions: Maricopa County exhibited very low mortality impact associated with the 1957 influenza pandemic. Understanding the relatively low excess-mortality rates and transmissibility in Maricopa County during this historic pandemic may help public health officials prepare for and mitigate future outbreaks of influenza.

Keywords: 1957 influenza; Arizona; Asian influenza; H2N2 virus; Maricopa County; Mathematical epidemiology; Mortality rates; Reproduction number; Transmissibility.


Figures

Fig. 1
Fig. 1
Timeline of Events in Arizona. A summary of the major events documenting the severity and spread of influenza and other respiratory illnesses in Arizona during the introduction of the H2N2 virus, based on articles in The Arizona Republic from June 1957-March 1958. For a more complete set of articles see https://www.dropbox.com/sh/irz1zzf8z613p8j/AACLkXzyXikWqskIssRv7aBha?dl=0
Fig. 2
Fig. 2
Age-specific respiratory mortality weekly time series. 2 Age-specific weekly time series of respiratory mortality per 10,000 population in Maricopa County, Arizona, 1954–1961. Areas outlined in gray represent the three expected pandemic waves: October 1, 1957-March 31, 1958; October 1, 1958-June 30, 1959; and October 1, 1959-June 30, 1960. The baseline mortality (black) was estimated using a cyclical Serfling linear regression model. The baseline mortality’s 95 % upper confidence limit (UCL) is also shown (red). Mortality attributable to the 1957 influenza pandemic was defined as the mortality rates (blue) in excess of the baseline mortality, when the mortality rates exceeded the 95 % UCL of the baseline mortality during the expected pandemic waves
Fig. 3
Fig. 3
Age-specific all-cause mortality weekly time series. Age-specific weekly time series of all-cause mortality per 10,000 population in Maricopa County, Arizona, 1954–1961. Areas outlined in gray represent the three expected pandemic waves: October 1, 1957-March 31, 1958; October 1, 1958-June 30, 1959; and October 1, 1959-June 30, 1960. The baseline mortality (black) was estimated using a cyclical Serfling linear regression model. The baseline mortality’s 95 % upper confidence limit (UCL) is also shown (red). Mortality attributable to the 1957 influenza pandemic was defined as the mortality rates (blue) in excess of the baseline mortality, when the mortality rates exceeded the 95 % UCL of the baseline mortality during the expected pandemic waves
Fig. 4
Fig. 4
Age-specific absolute respiratory excess mortality rates/10,000 population. Age-specific absolute excess-mortality rates per 10,000 population during the three expected pandemic waves (October 1, 1957-March 31, 1958; October 1, 1958-June 30, 1959; and October 1, 1959-June 30, 1960) of the 1957 pandemic in Maricopa County, Arizona based on deaths attributed to respiratory illnesses. Estimates were in excess of baseline mortality rates for a period with non-epidemic influenza based on a cyclical Serfling linear regression model and weekly respiratory mortality rates
Fig. 5
Fig. 5
Age-specific absolute all-cause excess mortality rates/10,000 population. Age-specific absolute excess-mortality rates per 10,000 population during three expected pandemic waves (October 1, 1957-March 31, 1958; October 1, 1958-June 30, 1959; and October 1, 1959-June 30, 1960) of the 1957 pandemic in Maricopa County, Arizona based on deaths attributed to all-causes. Estimates were in excess of baseline mortality rates for a period with non-epidemic influenza based on a cyclical Serfling linear regression model and weekly all-cause mortality rates

References

    1. Olson DR, Simonsen L, Edelson PJ, Morse SS. Epidemiological evidence of an early wave of the 1918 influenza pandemic in New York City. Proc Natl Acad Sci U S A. 2005;102(31):11059–63. doi: 10.1073/pnas.0408290102. - DOI - PMC - PubMed
    1. Chowell G, Viboud C, Simonsen L, Miller MA, Acuna-Soto R. Mortality pattern associated with the 1918 influenza pandemic in Mexico: evidence for a spring herald wave and lack of preexisting immunity in older populations. J Infect Dis. 2010;202(4):567–75. doi: 10.1086/654897. - DOI - PMC - PubMed
    1. Chowell G, Erkoreka A, Viboud C, Echeverri-Davila B. Spatial-temporal excess mortality patterns of the 1918–1919 influenza pandemic in Spain. BMC Infect Dis. 2014;14:371. doi: 10.1186/1471-2334-14-371. - DOI - PMC - PubMed
    1. Chandra S, Kuljanin G, Wray J. Mortality from the influenza pandemic of the 1918–1919: the case of India. Demography. 2012;49(3):857–65. doi: 10.1007/s13524-012-0116-x. - DOI - PubMed
    1. Reichert T, Chowell G, McCullers JA. The age distribution of mortality due to influenza: pandemic and peri-pandemic. BMC Med. 2012;10:162. doi: 10.1186/1741-7015-10-162. - DOI - PMC - PubMed

Publication types

MeSH terms