

Genome-wide identification and characterization of the NF-Y gene family in grape (vitis vinifera L.)
- PMID: 27516172
- PMCID: PMC4982312
- DOI: 10.1186/s12864-016-2989-3
Genome-wide identification and characterization of the NF-Y gene family in grape (vitis vinifera L.)
Abstract
Background: Nuclear factor Y (NF-Y) transcription factor is composed of three distinct subunits: NF-YA, NF-YB and NF-YC. Many members of NF-Y family have been reported to be key regulators in plant development, phytohormone signaling and drought tolerance. However, the function of the NF-Y family is less known in grape (Vitis vinifera L.).
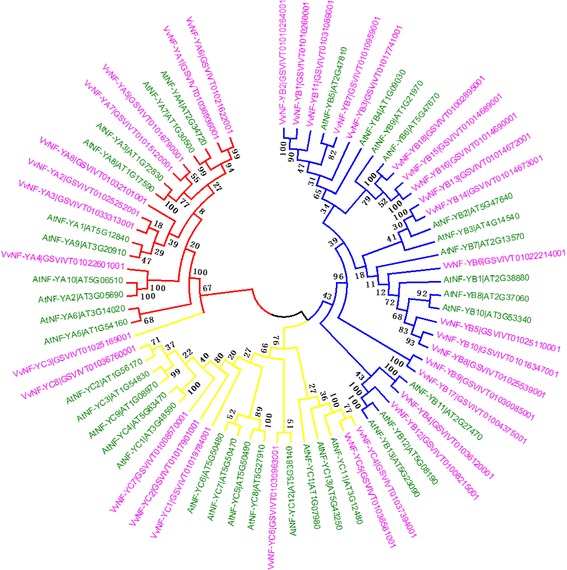
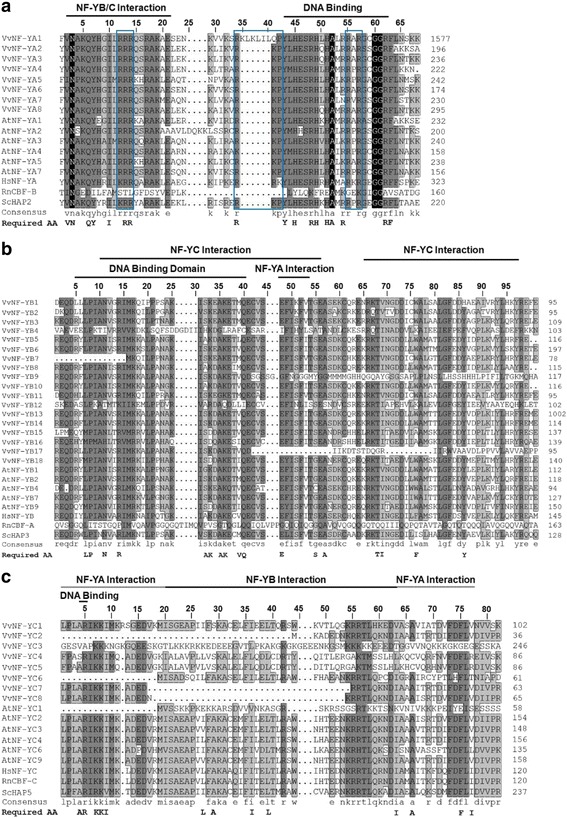
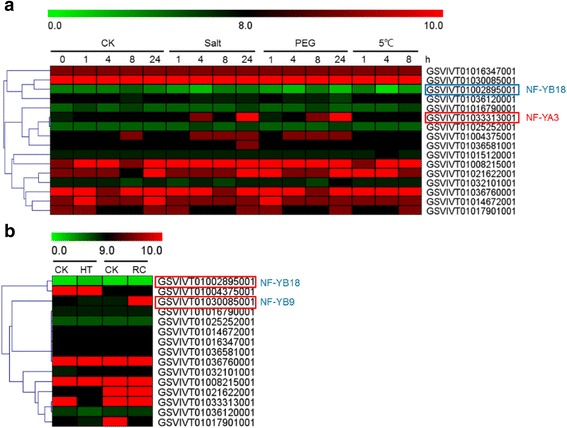
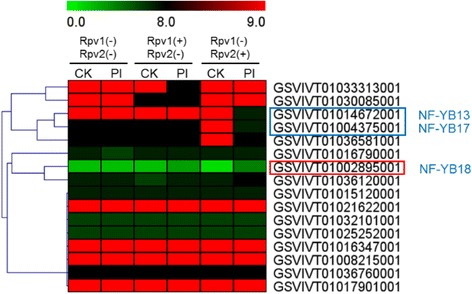
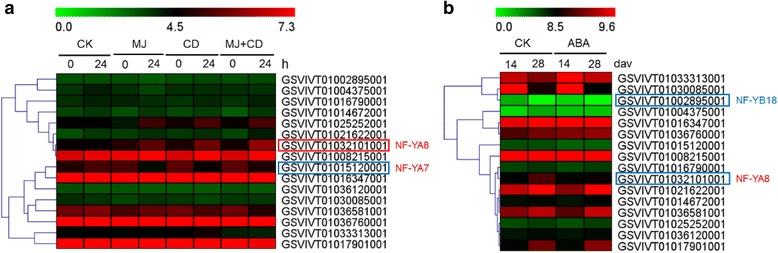
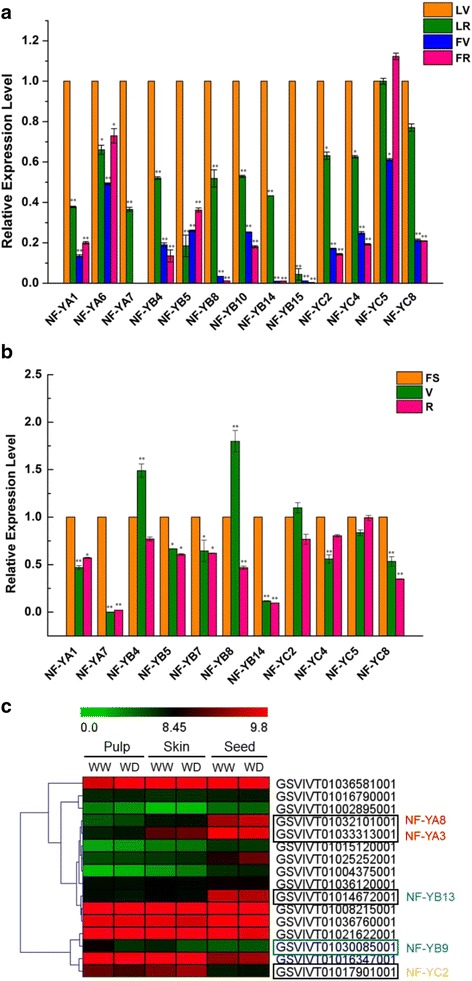
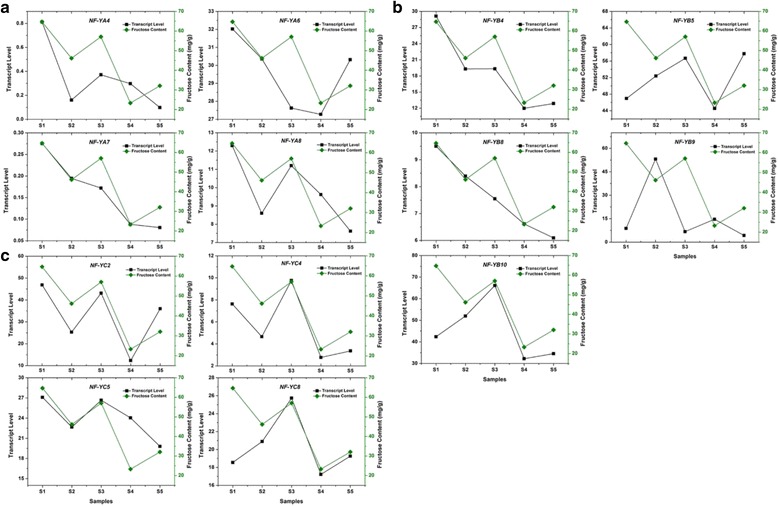
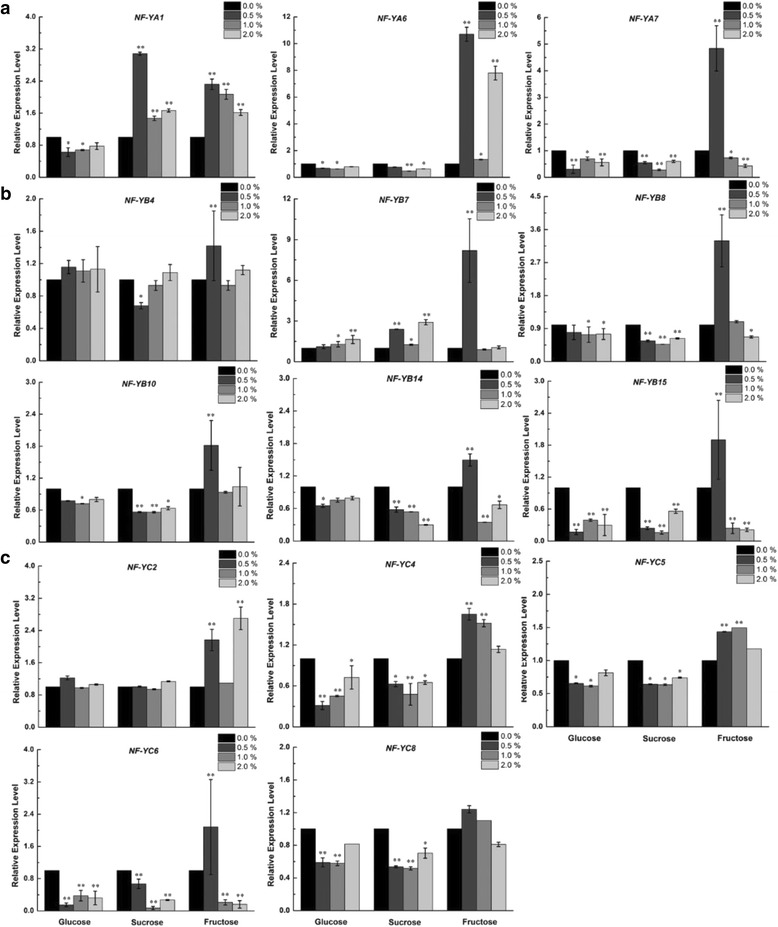
Results: A total of 34 grape NF-Y genes that distributed unevenly on grape (V. vinifera) chromosomes were identified in this study. Phylogenetic analysis was performed to predict functional similarities between Arabidopsis thaliana and grape NF-Y genes. Comparison of the structures of grape NF-Y genes (VvNF-Ys) revealed their functional conservation and alteration. Furthermore, we investigated the expression profiles of VvNF-Ys in response to various stresses, phytohormone treatments, and in leaves and grape berries with various sugar contents at different developmental stages. The relationship between VvNF-Y transcript levels and sugar content was examined to select candidates for exogenous sugar treatments. Quantitative real-time PCR (qPCR) indicated that many VvNF-Ys responded to different sugar stimuli with variations in transcript abundance. qPCR and publicly available microarray data suggest that VvNF-Ys exhibit distinct expression patterns in different grape organs and developmental stages, and a number of VvNF-Ys may participate in responses to multiple abiotic and biotic stresses, phytohormone treatments and sugar accumulation or metabolism.
Conclusions: In this study, we characterized 34 VvNF-Ys based on their distributions on chromosomes, gene structures, phylogenetic relationship with Arabidopsis NF-Y genes, and their expression patterns. The potential roles of VvNF-Ys in sugar accumulation or metabolism were also investigated. Altogether, the data provide significant insights on VvNF-Ys, and lay foundations for further functional studies of NF-Y genes in grape.
Keywords: Expression profiles; Grape (Vitis vinifera L.); NF-Y transcription factor; Phylogenetic analysis; Quantitative real-time PCR.
Figures
Similar articles
-
Identification and characterization of NF-Y gene family in walnut (Juglans regia L.).BMC Plant Biol. 2018 Oct 23;18(1):255. doi: 10.1186/s12870-018-1459-2. BMC Plant Biol. 2018. PMID: 30352551 Free PMC article.
-
Isolation, structural analysis, and expression characteristics of the maize nuclear factor Y gene families.Biochem Biophys Res Commun. 2016 Sep 16;478(2):752-8. doi: 10.1016/j.bbrc.2016.08.020. Epub 2016 Aug 4. Biochem Biophys Res Commun. 2016. PMID: 27498027
-
Characterization of the GATA gene family in Vitis vinifera: genome-wide analysis, expression profiles, and involvement in light and phytohormone response.Genome. 2018 Oct;61(10):713-723. doi: 10.1139/gen-2018-0042. Epub 2018 Aug 9. Genome. 2018. PMID: 30092656
-
An update on sugar transport and signalling in grapevine.J Exp Bot. 2014 Mar;65(3):821-32. doi: 10.1093/jxb/ert394. Epub 2013 Dec 9. J Exp Bot. 2014. PMID: 24323501 Review.
-
Plant NF-Y transcription factors: Key players in plant-microbe interactions, root development and adaptation to stress.Biochim Biophys Acta Gene Regul Mech. 2017 May;1860(5):645-654. doi: 10.1016/j.bbagrm.2016.11.007. Epub 2016 Dec 8. Biochim Biophys Acta Gene Regul Mech. 2017. PMID: 27939756 Review.
Cited by
-
Expression patterns of the poplar NF-Y gene family in response to Alternaria alternata and hormone treatment and the role of PdbNF-YA11 in disease resistance.Front Bioeng Biotechnol. 2022 Sep 16;10:956271. doi: 10.3389/fbioe.2022.956271. eCollection 2022. Front Bioeng Biotechnol. 2022. PMID: 36185440 Free PMC article.
-
Identification and characterization of NF-Y gene family in walnut (Juglans regia L.).BMC Plant Biol. 2018 Oct 23;18(1):255. doi: 10.1186/s12870-018-1459-2. BMC Plant Biol. 2018. PMID: 30352551 Free PMC article.
-
Discovering Causal Relationships in Grapevine Expression Data to Expand Gene Networks. A Case Study: Four Networks Related to Climate Change.Front Plant Sci. 2018 Sep 21;9:1385. doi: 10.3389/fpls.2018.01385. eCollection 2018. Front Plant Sci. 2018. PMID: 30298082 Free PMC article.
-
Genome-Wide Identification and Analysis of the NF-Y Transcription Factor Family Reveal Its Potential Roles in Salt Stress in Alfalfa (Medicago sativa L.).Int J Mol Sci. 2022 Jun 8;23(12):6426. doi: 10.3390/ijms23126426. Int J Mol Sci. 2022. PMID: 35742869 Free PMC article.
-
Identification, Structural Characterization and Gene Expression Analysis of Members of the Nuclear Factor-Y Family in Chickpea (Cicer arietinum L.) under Dehydration and Abscisic Acid Treatments.Int J Mol Sci. 2018 Oct 23;19(11):3290. doi: 10.3390/ijms19113290. Int J Mol Sci. 2018. PMID: 30360493 Free PMC article.
References
Publication types
MeSH terms
Substances
LinkOut - more resources
Full Text Sources
Other Literature Sources
