Functional relevance of naturally occurring mutations in adhesion G protein-coupled receptor ADGRD1 (GPR133)
- PMID: 27516204
- PMCID: PMC4982218
- DOI: 10.1186/s12864-016-2937-2
Functional relevance of naturally occurring mutations in adhesion G protein-coupled receptor ADGRD1 (GPR133)
Abstract
Background: A large number of human inherited and acquired diseases and phenotypes are caused by mutations in G protein-coupled receptors (GPCR). Genome-wide association studies (GWAS) have shown that variations in the ADGRD1 (GPR133) locus are linked with differences in metabolism, human height and heart frequency. ADGRD1 is a Gs protein-coupled receptor belonging to the class of adhesion GPCRs.
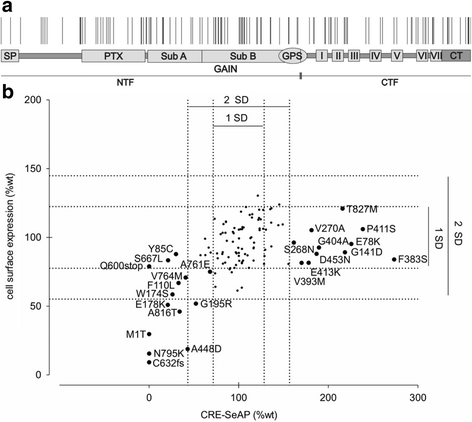
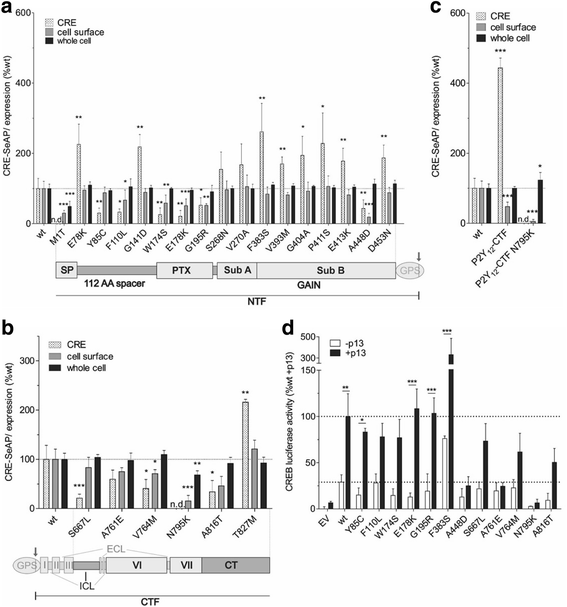
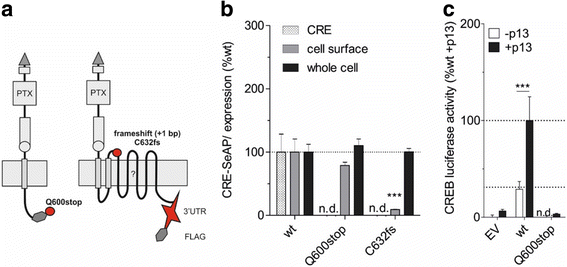
Results: Analysis of more than 1000 sequenced human genomes revealed approximately 9000 single nucleotide polymorphisms (SNPs) in the human ADGRD1 as listed in public data bases. Approximately 2.4 % of these SNPs are located in exons resulting in 129 non-synonymous SNPs (nsSNPs) at 119 positions of ADGRD1. However, the functional relevance of those variants is unknown. In-depth characterization of these amino acid changes revealed several nsSNPs (A448D, Q600stop, C632fs [frame shift], A761E, N795K) causing full or partial loss of receptor function, while one nsSNP (F383S) significantly increased basal activity of ADGRD1.
Conclusion: Our results show that a broad spectrum of functionally relevant ADGRD1 variants is present in the human population which may cause clinically relevant phenotypes, while being compatible with life when heterozygous.
Keywords: ADGRD1; Adhesion GPCR; Database; GPR133; Mutations; SNP.
Figures


Similar articles
-
Functional impact of intramolecular cleavage and dissociation of adhesion G protein-coupled receptor GPR133 (ADGRD1) on canonical signaling.J Biol Chem. 2021 Jan-Jun;296:100798. doi: 10.1016/j.jbc.2021.100798. Epub 2021 May 20. J Biol Chem. 2021. PMID: 34022221 Free PMC article.
-
Upregulation of mRNA Expression of ADGRD1/GPR133 and ADGRG7/GPR128 in SARS-CoV-2-Infected Lung Adenocarcinoma Calu-3 Cells.Cells. 2024 May 7;13(10):791. doi: 10.3390/cells13100791. Cells. 2024. PMID: 38786015 Free PMC article.
-
ADGRD1 as a Potential Prognostic and Immunological Biomarker in Non-Small-Cell Lung Cancer.Biomed Res Int. 2022 Nov 22;2022:5699892. doi: 10.1155/2022/5699892. eCollection 2022. Biomed Res Int. 2022. PMID: 36457341 Free PMC article.
-
Pharmacogenetics of the G protein-coupled receptors.Methods Mol Biol. 2014;1175:189-242. doi: 10.1007/978-1-4939-0956-8_9. Methods Mol Biol. 2014. PMID: 25150871 Review.
-
Computational prediction of the effects of non-synonymous single nucleotide polymorphisms in human DNA repair genes.Neuroscience. 2007 Apr 14;145(4):1273-9. doi: 10.1016/j.neuroscience.2006.09.004. Epub 2006 Oct 19. Neuroscience. 2007. PMID: 17055652 Review.
Cited by
-
Patterns of allele frequency differences among domestic cat breeds assessed by a 63K SNP array.PLoS One. 2021 Feb 25;16(2):e0247092. doi: 10.1371/journal.pone.0247092. eCollection 2021. PLoS One. 2021. PMID: 33630878 Free PMC article.
-
Adhesion G protein-coupled receptors in glioblastoma.Neurooncol Adv. 2021 Mar 23;3(1):vdab046. doi: 10.1093/noajnl/vdab046. eCollection 2021 Jan-Dec. Neurooncol Adv. 2021. PMID: 33959717 Free PMC article. Review.
-
Naturally Occurring Missense MRGPRX2 Variants Display Loss of Function Phenotype for Mast Cell Degranulation in Response to Substance P, Hemokinin-1, Human β-Defensin-3, and Icatibant.J Immunol. 2018 Jul 15;201(2):343-349. doi: 10.4049/jimmunol.1701793. Epub 2018 May 23. J Immunol. 2018. PMID: 29794017 Free PMC article.
-
Activation of the adhesion G protein-coupled receptor GPR133 by antibodies targeting its N-terminus.J Biol Chem. 2022 Jun;298(6):101949. doi: 10.1016/j.jbc.2022.101949. Epub 2022 Apr 18. J Biol Chem. 2022. PMID: 35447113 Free PMC article.
-
Whole genome sequencing identified genomic diversity and candidated genes associated with economic traits in Northeasern Merino in China.Front Genet. 2024 Jan 25;15:1302222. doi: 10.3389/fgene.2024.1302222. eCollection 2024. Front Genet. 2024. PMID: 38333624 Free PMC article.
References
-
- Piao X, Hill RS, Bodell A, Chang BS, Basel-Vanagaite L, Straussberg R, Dobyns WB, Qasrawi B, Winter RM, Innes AM, Voit T, Ross ME, Michaud JL, Descarie J, Barkovich AJ, Walsh CA. G protein-coupled receptor-dependent development of human frontal cortex. Science (New York, NY) 2004;303:2033–2036. doi: 10.1126/science.1092780. - DOI - PubMed
MeSH terms
Substances
LinkOut - more resources
Full Text Sources
Other Literature Sources
Molecular Biology Databases

