. 2016 Oct 1;25(19):4244-4255.
doi: 10.1093/hmg/ddw256. Epub 2016 Aug 11.

Reprogramming towards anabolism impedes degeneration in a preclinical model of retinitis pigmentosa

Affiliations

Reprogramming towards anabolism impedes degeneration in a preclinical model of retinitis pigmentosa

Lijuan Zhang et al. Hum Mol Genet. .

Abstract

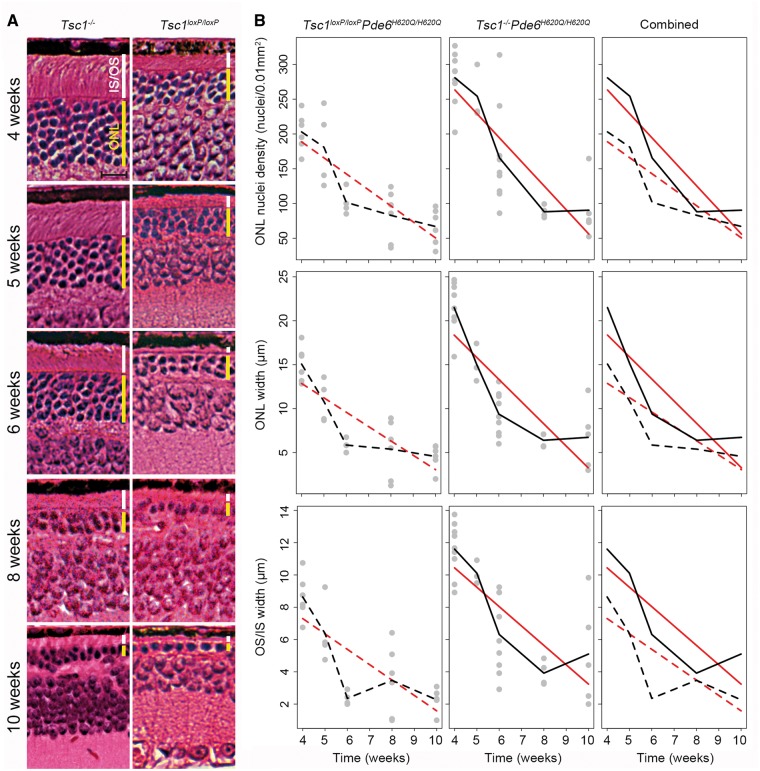
Retinitis pigmentosa (RP) is an incurable neurodegenerative condition featuring photoreceptor death that leads to blindness. Currently, there is no approved therapeutic for photoreceptor degenerative conditions like RP and atrophic age-related macular degeneration (AMD). Although there are promising results in human gene therapy, RP is a genetically diverse disorder, such that gene-specific therapies would be practical in a small fraction of patients with RP. Here, we explore a non-gene-specific strategy that entails reprogramming photoreceptors towards anabolism by upregulating the mechanistic target of rapamycin (mTOR) pathway. We conditionally ablated the tuberous sclerosis complex 1 (Tsc1) gene, an mTOR inhibitor, in the rods of the Pde6bH620Q/H620Q preclinical RP mouse model and observed, functionally and morphologically, an improvement in the survival of rods and cones at early and late disease stages. These results elucidate the ability of reprogramming the metabolome to slow photoreceptor degeneration. This strategy may also be applicable to a wider range of neurodegenerative diseases, as enhancement of nutrient uptake is not gene-specific and is implicated in multiple pathologies. Enhancing anabolism promoted neuronal survival and function and could potentially benefit a number of photoreceptor and other degenerative conditions.


Figures

Figure 1.
Figure 1.
ERG b-wave magnitudes and histology are comparable in Tsc1-/-Pde6bH620Q/+ and Tsc1loxP/loxPPde6bH620Q/+ mice. (A-C) Scotopic, mixed maximal, and photopic ERG recordings were acquired at 5 weeks post injection. Small grey dots represent data points from eyes; bold red dots represent means for the Tsc1-/-Pde6bH620Q/+ mice, and bold black dots represent means for the Tsc1loxP/loxPPde6bH620Q/+ mice. To compare mean ERG outcomes or mean histological outcomes between the Tsc1-/-Pde6bH620Q/+ and Tsc1loxP/loxPPde6bH620Q/+ groups, linear mixed models with random intercepts for mice were fit. Average b-wave magnitudes between the groups had no statistically significant mean difference. ((A) P = 0.80; (B) P = 0.59; (C) P = 0.89). (D-F) H&E staining of retinal sections also had comparable mean ONL and IS/OS layers between the groups. These values were quantified by measuring the thickness of the ONL and IS/OS, which were observed to be statistically insignificant. ((D) Yellow bar indicates ONL, white bar indicates IS/OS, scale bar = 50 µm; (E) P = 0.98 (F) P = 0.78; for ERG, n =  8 for Tsc1-/-Pde6bH620Q/+, n =  7 for Tsc1loxP/loxPPde6bH620Q/+; for histology, n = 7 for both groups.).
Figure 2.
Figure 2.
Tsc1-/-Pde6bH620Q/H620Qhave enhanced photoreceptor survival compared to Tsc1loxP/loxPPde6bH620Q/H620Qcontrols for at least 3 weeks. (A) H&E-stained retinal sections were compared at 10, 17, and 24 days. ONL and IS/OS thickness were greater at every time point in the Tsc1-/-Pde6bH620Q/H620Qgroup compared to controls. Tamoxifen or oil injection occurred at P10. Histology was quantified statistically over time. (Yellow bar indicates ONL, white bar indicates IS/OS, scale bar = 20 μm.). (B) ONL nuclei density and ONL layer width were greater in Tsc1-/-Pde6bH620Q/H620Q mice compared to Tsc1loxP/loxPPde6bH620Q/H620Q mice at every time point. IS/OS width was quantified and observed to increase over time in both groups, although the Tsc1-/-Pde6bH620Q/H620Q group had a greater mean thickness at each time point compared to the controls. Predicted trend lines for the ONL had steeper slopes for the control mice compared to the experimental group for both nuclei density and layer thickness. IS/OS trend lines were positively sloped and steeper for the experimental group compared to controls. (Grey dots represent individual mouse data points. Black lines connect the mean outcome at each time point; red lines are estimated mean trend lines from linear regression models, assuming linearity of the outcome over time. Dashed lines are used for controls, and solid lines are used for knockout mice. Comparisons of Tsc1-/-Pde6bH620Q/H620Q versus Tsc1loxP/loxPPde6bH620Q/H620Q controls at fixed points: ONL nuclei density: P17 P < 0.001, P24 P < 0.001; ONL width: P17 P < 0.001; P24 P = 0.001. IS/OS width: P17 P = 0.02, P24 P = 0.009. Comparison of the slopes between the two groups from the linear regression models: ONL density: P = 0.02, ONL width P = 0.003, IS/OS P = 0.06. P10 n =  4 for both groups, P17 and P24 n =  5 for Tsc1-/-Pde6bH620Q/H620Q and n =  4 for Tsc1loxP/loxPPde6bH620Q/H620Q).
Figure 3.
Figure 3.
Tsc1-/-Pde6bH620Q/H620Qhave improved retinal survival compared to Tsc1loxP/loxPPde6bH620Q/H620Qcontrols for at least 10 weeks. (A) H&E-stained retinal sections were compared at 4, 5, 6, 8, and 10 weeks. Mean ONL and IS/OS thickness were greater at every time point in the Tsc1-/-Pde6bH620Q/H620Qgroup, compared to controls. (Yellow bar indicates ONL, white bar indicates IS/OS, scale bar = 20 µm.) (B) This difference was quantified by counting ONL nuclei density and measuring the width of the ONL and IS/OS over time. Tsc1-/-Pde6bH620Q/H620Q mice had higher mean nuclei numbers and mean layer width in the ONL and IS/OS at all-time points compared to controls, although the differences between the groups diminished over time. The predicted trend line for the ONL nuclei density and width was negative for both groups but steeper for the treated group. The IS/OS predicted trend line between the groups had comparable slopes. (Grey dots represent individual mouse data points. Black lines connect the mean outcome at each time point. Red lines are estimated mean trend lines from linear regression models, assuming linearity of the outcome over time. Dashed lines are used for controls, and solid lines are used for knockout mice. Comparisons of Tsc1-/-Pde6bH620Q/H620Q versus Tsc1loxP/loxPPde6bH620Q/H620Q at fixed points: ONL nuclei density: Week 4 P < 0.001, Week 5 P = 0.10, Week 6 P = 0.03, Week 8 P = 0.75, Week 10 P = 0.33; ONL width: Week 4 P < 0.001, Week 5 P = 0.06, Week 6 P = 0.002, Week 8 P = 0.49, Week 10 P = 0.27; IS/OS width: Week 4 P = 0.002, Week 5 P = 0.02, Week 6 P < 0.001, Week 8 P = 0.65, Week 10 P = 0.12. Comparison of the slopes between the two groups from the linear regression models: ONL density P = 0.06, ONL width P = 0.05, IS/OS P = 0.39. First n value represents Tsc1-/-Pde6bH620Q/H620Q, and second n represents Tsc1loxP/loxPPde6bH620Q/H620Q: Week 4 n =  9 and n =  6, Week 5 n =  5 and n =  4, Week 6 n =  9 and n =  4, Week 8 n =  4 and n =  6, Week 10 n =  5 and n =  6.).
Figure 4.
Figure 4.
Retinal function was statistically improved in Tsc1-/-Pde6bH620Q/H620Q mice compared to controls. (A) ERG scotopic, photopic, and mixed b-wave amplitudes were acquired over time, and mean b-wave responses were higher in Tsc1-/-Pde6bH620Q/H620Q mice compared with controls. (Grey lines are eyes from individual mice. From the linear mixed models, solid black lines are estimated mean trajectories for the controls, and dashed black lines are for the experimental group. Likelihood ratio tests: Scotopic P < 0.001, Mixed P = 0.002, Photopic P = 0.01. Week 4 both groups n =  6, Week 6 n =  6 for Tsc1-/-Pde6bH620Q/H620Q n =  5 for Tsc1loxP/loxPPde6bH620Q/H620Q, Week 8 both groups n =  5, Week 10 both groups n =  4, Week 12 n =  4 for Tsc1-/-Pde6bH620Q/H620Q, n =  0 for Tsc1loxP/loxPPde6bH620Q/H620Q). (B) Comparisons of knockout versus control mice at fixed points revealed that mean b-wave recordings were higher at every time point in the Tsc1-/-Pde6bH620Q/H620Q group compared to controls and were statistically significant at each time point. (Small grey dots represent data points from individual eyes; bold red dots represent means for the Tsc1loxP/loxPPde6bH620Q/H620Q, while bold black dots represent means for Tsc1-/-Pde6bH620Q/H620Q. Scotopic: Week 4 P = 0.02, Week 6 P = 0.08, Week 8 P = 0.04. Mixed: Week 4 P = 0.003, Week 6 P = 0.003, Week 8 P = 0.01. Photopic: Week 4 P < 0.001, Week 6 P = 0.001, Week 8 P = 0.02).
Figure 5.
Figure 5.
RHO immunoreactivity reveals rod preservation over 12 weeks in Tsc1-/-Pde6bH620Q/H620Qmice. (A) Immunofluorescence staining of RHO was more intense in the IS/OS layer of Tsc1-/-Pde6bH620Q/H620Q mice compared to controls at every time point. (Scale bar = 20 μm.) (B) The width of RHO-expression in the IS/OS was measured at 300 microns from the optic nerve and quantified. A statistically greater mean width in the experimental group compared to controls was found at every time point. (Grey circles represent data from individual control mice; grey triangles represent individual experimental mice. The solid black line connects means for controls, and the dashed black line represents means for the experimental group. Week 4 P = 0.008, Week 6 P < 0.001, Week 8 P = 0.005, Week 10 P = 0.006, Week 12 P < 0.001. Week 4 n = 6 for both groups, Week 6 n = 4 for Tsc1-/-Pde6bH620Q/H620Q, n = 5 for Tsc1loxP/loxPPde6bH620Q/H620Q, Week 8 n = 5 for Tsc1-/-Pde6bH620Q/H620Q, n =  4 for Tsc1loxP/loxPPde6bH620Q/H620Q, Weeks 10 and 12 n = 4 for both groups.).
Figure 6.
Figure 6.
Cone arrestin immunoreactivity reveals suggests cone preservation over time in Tsc1-/-Pde6bH620Q/H620Q mice. (A) Cones were stained with anti-cone arrestin antibody at multiple time points. Higher mean anti-cone arrestin immunoreactivity was observed in the Tsc1-/-Pde6bH620Q/H620Q mice, compared to controls at every time point. In both groups, there was a decline in staining over time. (Scale bar = 20 µm.). (B) Photoreceptor nuclei numbers were quantified, and a statistically significant higher mean density was observed for the experimental group at every time point. (Grey circles represent data from individual mice from the control group; grey triangles represent individual mice from the experimental group. The solid black line represents means for controls, and the dashed black line represents means for the experimental group. For all-time points, n =  4 for both groups, and P < 0.001, except Week 20, where P = 0.002.
Figure 7.
Figure 7.
Downstream targets of mTOR are upregulated in Tsc1-/-Pde6bH620Q/H620Q mice. (A) Increased expression of phosphorylated mTOR and the downstream protein S6 was detected in immunofluorescence staining in the IS/OS layers as well as the ONL in the experimental mice. Merged DAPI images of nuclei revealed the location of the ONL. (Scale bar = 20 µm.) (B) Immunoblot revealed upregulated mTOR, p-mTOR, pS6, GLUT1, and p4EBP1 expression levels and downregulated TSC1 levels in the experimental versus control groups. S6, 4EBP1, SREBP1, and ATG5 expression levels were not significantly affected by Tsc1 ablation. Actin and tubulin served as loading controls. (C) Protein expression was quantified by analysing the fold change between the control and experimental groups. There was a statistically significant increase in mean protein expression in mTOR, p-mTOR, p4EBP1, pS6, and GLUT1, and a significant decrease in mean expression in TSC1 in the experimental group compared to the controls. (TSC1 P < 0.05, mTOR P < 0.05, p-mTOR P < 0.05, 4EBP1 P = 0.49, p4EBP1 P < 0.05, S6 P = 0.78, pS6 P < 0.05, SREBP P = 0.76, ATG5 P = 0.95. n =  4 for both groups.).
Figure 8.
Figure 8.
No tumour formation up to 16 months following Tsc1 ablation in Pde6bH620Q/H620Q mice. Tsc1-/-Pde6bH620Q/H620Q mice were observed for sixteen months. Major organs were subsequently harvested and subjected to H&E staining, which did not reveal tumour formations in any tested organs (n =  5).

References

    1. Hartong D.T., Berson E.L., Dryja T.P. (2006) Retinitis pigmentosa. Lancet, 368, 1795–1809. - PubMed
    1. Hamel C. (2006) Retinitis pigmentosa. Otphanet J. Rare Dis., 1, 40. - PMC - PubMed
    1. Fahim A.T., Daiger S.P., Weleber R.G. (1993) Pagon R.A., Adam M.P., Ardinger H.H., Wallace S.E., Amemiya A., Bean L.J.H., Bird T.D., Fong C.T., Mefford H.C., Smith R.J.H., Stephens K. (eds.), In GeneReviews(R), Seattle (WA: ), in press.
    1. Lin M.K., Tsai Y.T., Tsang S.H. (2015) Emerging treatments for retinitis pigmentosa: Genes and stem cells, as well as new electronic and medical therapies, are gaining ground. Retin Physician, 12, 52–70. - PMC - PubMed
    1. Daiger S.P., Bowne S.J., Sullivan L.S. (2007) Perspective on genes and mutations causing retinitis pigmentosa. Arch. Ophthalmol., 125, 151–158. - PMC - PubMed

MeSH terms