Coenzyme A corrects pathological defects in human neurons of PANK2-associated neurodegeneration
- PMID: 27516453
- PMCID: PMC5048368
- DOI: 10.15252/emmm.201606391
Coenzyme A corrects pathological defects in human neurons of PANK2-associated neurodegeneration
Abstract
Pantothenate kinase-associated neurodegeneration (PKAN) is an early onset and severely disabling neurodegenerative disease for which no therapy is available. PKAN is caused by mutations in PANK2, which encodes for the mitochondrial enzyme pantothenate kinase 2. Its function is to catalyze the first limiting step of Coenzyme A (CoA) biosynthesis. We generated induced pluripotent stem cells from PKAN patients and showed that their derived neurons exhibited premature death, increased ROS production, mitochondrial dysfunctions-including impairment of mitochondrial iron-dependent biosynthesis-and major membrane excitability defects. CoA supplementation prevented neuronal death and ROS formation by restoring mitochondrial and neuronal functionality. Our findings provide direct evidence that PANK2 malfunctioning is responsible for abnormal phenotypes in human neuronal cells and indicate CoA treatment as a possible therapeutic intervention.
Keywords: PKAN; Coenzyme A; hiPSC; iron; neurodegeneration.
© 2016 The Authors. Published under the terms of the CC BY 4.0 license.
Figures

RT–PCR analysis of pluripotency markers expressed by hiPSC clones. Fgf4: fibroblast growth factor 4; Gdf3: growth differentiation factor‐3; Rex1: reduced expression 1; Tert: telomerase reverse transcriptase; Klf4: Kruppel‐like factor 4; Sox2: sex determining region Y‐box 2; c‐myc: Myc proto‐oncogene protein; Dppa2/4: developmental pluripotency‐associated 2/4; Oct4: octamer‐binding transcription factor 4; Tdgf: teratocarcinoma‐derived growth factor; Gapdh: glyceraldehyde 3‐phosphate dehydrogenase.
Representative images of hiPSC colonies immunostained with pluripotency markers: Oct4, SSEA‐1, NANOG, Tra‐1‐60, Sox2. Nuclei stained with Hoechst. Scale bar 100 μm.
qRT–PCR of NANOG expression levels in hiPSCs. All clones expressed significantly higher levels of NANOG than control fibroblasts. Data presented as means + SEM of three independent replicates (unpaired two‐tailed t‐test).
Representative images of hiPSCs differentiated in vitro into all three germ layers (endoderm, FoxA2; mesoderm, SMA; ectoderm, Tuj1). Nuclei were stained with Hoechst dye. Scale bar 20 μm.

DNA sequence analysis of the hiPSC clones confirmed the presence of PANK2 mutations.
Karyotype analysis of hiPSC lines displayed a normal karyotype.
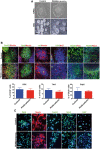
Representative images of hiPSCs (top) and embryoid bodies (EBs) (bottom) at day 7. Scale bar 100 μm.
Representative IF images for rosettes at 10 days obtained from EBs. Neural rosette clusters express the typical markers (FoxG1, Nestin, Pax6, zo1, ki67, DCX, Tbr2, Ctip2). Nuclei were stained with Hoechst dye. Scale bar 100 μm. Histograms represent the average percentage + SEM of DCX‐, Tbr2‐ and Ctip2‐positive cells of three independent replicates (unpaired two‐tailed t‐test).
Representative IF images of NPCs obtained from neural rosettes. NPCs expressed the markers Pax6, Nestin, FoxG1, Sox2, and ki67. Nuclei were stained with Hoechst dye. Scale bar 20 μm.
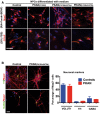
Representative IF images of control and PKAN NPCs differentiated into neurons and astrocytes with specific medium factors. Scale bar 20 μm.
Representative IF images at 3 weeks of neurons induced with Ngn2 expression from control and PKAN NPCs. Scale bar 20 μm. Nuclei were stained with Hoechst dye. Histogram represents the average percentage of 3 controls and 3 PKAN patients of VGLUT1‐ (shown in Fig 1B), TH‐ and GABA‐positive neurons, + SEM (unpaired two‐tailed t‐test).

Representative IF image of NPCs stained for Nestin, FoxG1, and Pank2.
NPCs differentiated into neurons by overexpressing Ngn2 (one representative experiment is shown). Two weeks after the infection differentiated NPC were positive for neuronal markers βIII tubulin (Tuj1), Map2, NeuN and human nuclei (hNu) and synaptic markers, the voltage‐gated Na+ channels (PanNav), and the vesicular glutamate transporter 1 (VGlut1).
Western blot of soluble cell homogenates from human neurons probed with PANK2 and β‐actin antibodies (arrows). Asterisk indicates nonspecific band. Data are representative of three independent experiments.
Plots showing the total dendritic length and branching points. Data presented as mean + SEM from at least three independent experiments. A total of 38 neurons were counted for each sample. Statistics were determined by the t‐test and resulted not significant.
Representative example of co‐culture containing control (green), PKAN (red) human neurons, and E18 cortical mouse neurons. Control and PKAN NPCs were infected with GFP‐LV and tdT‐LV expressing vectors, respectively, and differentiated for 8 weeks.
Examples of electrophysiological properties of human neurons: control individual (top); PKAN patient (bottom). Traces on the left represent trains of action potentials induced by injection of a suprathreshold current step through the patch electrode in current‐clamp mode. Middle traces show Na+ and K+ currents (down‐ and upward‐deflecting from baseline, respectively) in response to a 60 mV step from a holding voltage of −70 mV in voltage‐clamp mode. Insets on the right display enlarged portions of the traces to magnify fast Na+ currents.
Histogram with percentages of recorded cells showing repetitive firing. Data presented as mean + SEM, Controls n = 32, PKAN patients n = 23 (z‐test).
- A
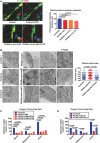
Representative images of human neurons cells stained with the mitochondrial membrane potential‐sensitive fluorescent probe TMRM, the neuronal‐specific anti‐NCAM antibody, and the nuclear‐staining Hoechst. Left panel, basal conditions. Right panel, after addition of the mitochondrial uncoupler FCCP. Scale bar 20 μm. Plot showing the quantification of TMRM fluorescence signal from NCAM+ neurons. Data presented as means + SEM of three independent experiments (unpaired, two‐tailed t‐test).
- B
Representative images of ultrastructural analysis of fixed neurons examined with electron microscope. PANK2 panel represents PKAN neuronal cells overexpressing PANK2 protein. Scale bar 500 nm. Mitochondrial size was measured at level of the larger diameter along the perpendicular axis for all the mitochondria in > 30 fields (200 mitochondria in total) for each sample (one‐way ANOVA).
- C, D
(C) OCR measurements of controls and each PKAN patients analyzed individually and (D) data obtained by individual analysis and plotted as grouped controls, PKAN patients, and PKAN patients overexpressing PANK2. The plots show OCR normalization to cell number. OCR was measured in basal conditions, and after oligomycin and FCCP addition. Bars indicate means + SEM of three independent experiments (two‐way ANOVA).

Representative images of neurons stained with the neuron‐specific anti‐NCAM antibody, ROS‐sensitive fluorescent probe DCF, and the nuclear dye Hoechst. Scale bar 20 μm. Plots of the DCF fluorescence signal from NCAM‐positive control and PKAN human neurons, infected or not with Ngn2‐PANK2‐LV. Data presented as means + SEM of at least three independent experiments (one‐way ANOVA).
Representative images of neurons stained with ThiolTracker Violet and the anti‐Tuj1. Scale bar 20 μm. ThiolTracker Violet fluorescence signal from Tuj1‐positive neurons was quantified and shown in the plots. Data presented as means + SEM of at least three independent experiments (unpaired, two‐tailed t‐test).
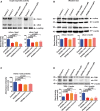
Upper panel: representative images of in‐gel enzymatic activity of mitochondrial and cytosolic aconitases (mAco and cAco, respectively). The lower part of the gel was cut, stained with Coomassie blue, and a protein band was used as loading control (Loading). Lower panel: quantification of mAco and cAco enzymatic activity by densitometry.
Upper panel: Western blot analysis of mitochondrial and cytosolic aconitases. Lower panel: quantification of mAco and cAco by densitometry.
Heme quantification by absorbance at 400 nm of the soluble cell lysates.
Upper panel: Western blot analysis of transferrin receptor (TfR1) and ferritin (FtH). Lower panel: quantification of TfR1 or FtH normalized on actin by densitometry.
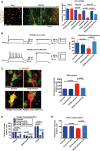
Representative images of co‐cultures of control and PKAN NPCs infected with GFP‐LV and tdT‐LV expressing vectors, respectively, at the beginning (Day 1), after 120 (Day 120) and 150 days of differentiation (Day 150). Scale bar 20 μm. Plots show the number of green and red human neurons counted at different time points. All data are presented as means + SEM of at least three independent experiments (one‐way ANOVA).
Example of electrophysiological properties of cultured PKAN human neurons with or without CoA incubation for 30 days. Repetitive firing activity (left) and relatively large Na+ and K+ currents (right) were restored by CoA. The histogram on the right shows fractions of repetitively firing cells recorded in untreated vs. CoA‐treated neurons from control and PKAN patients. Data presented as mean + SEM, Controls n = 20, Controls+CoA n = 12, PKAN patients n = 21, PKAN patients+CoA n = 14 (z‐test).
An example of neurons stained with the ROS‐sensitive fluorescent probe DCF and the nuclear dye Hoechst. Anti‐NCAM antibody was used to detect neurons. Scale bar 20 μm. Plots of the DCF fluorescence signal from NCAM+ control and PKAN human neurons differentiated or not in the presence of CoA (25 μM) in the medium for 3 weeks. All data are presented as means + SEM of at least three independent experiments (one‐way ANOVA).
Oxygen consumption rate (OCR) with and without CoA on controls and PKAN patients. Basal and uncoupled (FCCP) respiration increased after CoA supplementation. Data presented as means + SEM of 24 independent replicates for each condition (two‐way ANOVA).
Heme quantification by absorbance at 400 nm of the soluble NPC cell lysates. All data are presented as means + SEM of at least three independent experiments (one‐way ANOVA).
References
Publication types
MeSH terms
Substances
Grants and funding
LinkOut - more resources
Full Text Sources
Other Literature Sources

