. 2016 Aug 12;353(6300):691-4.
doi: 10.1126/science.aaf7560. Epub 2016 Aug 11.

Imprinting and recalling cortical ensembles

Affiliations

Imprinting and recalling cortical ensembles

Luis Carrillo-Reid et al. Science. .

Abstract

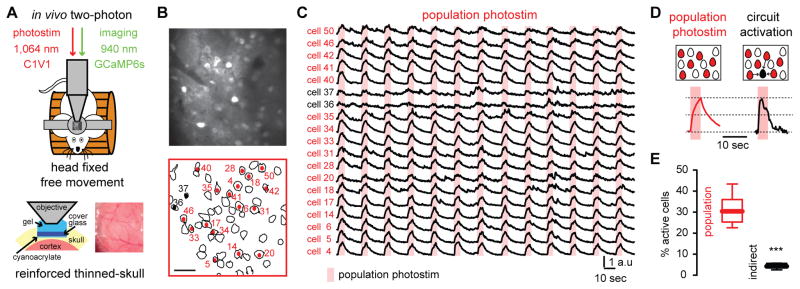
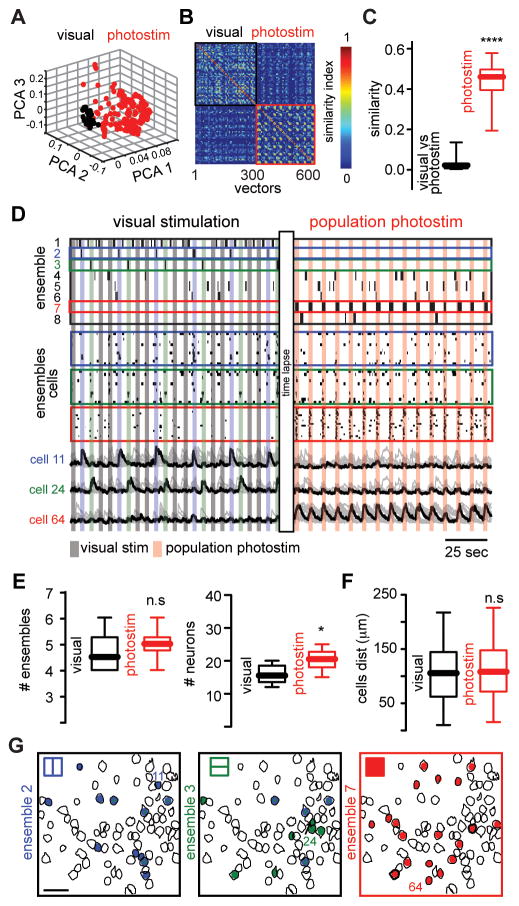
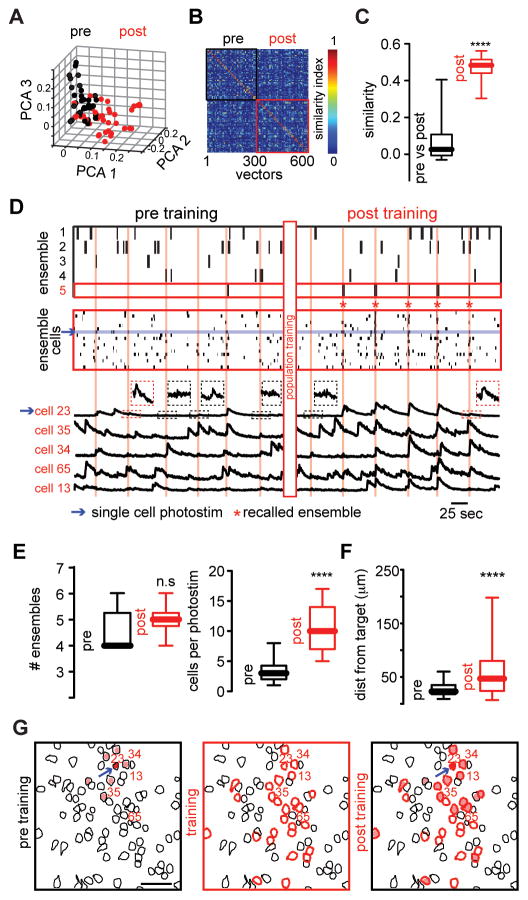
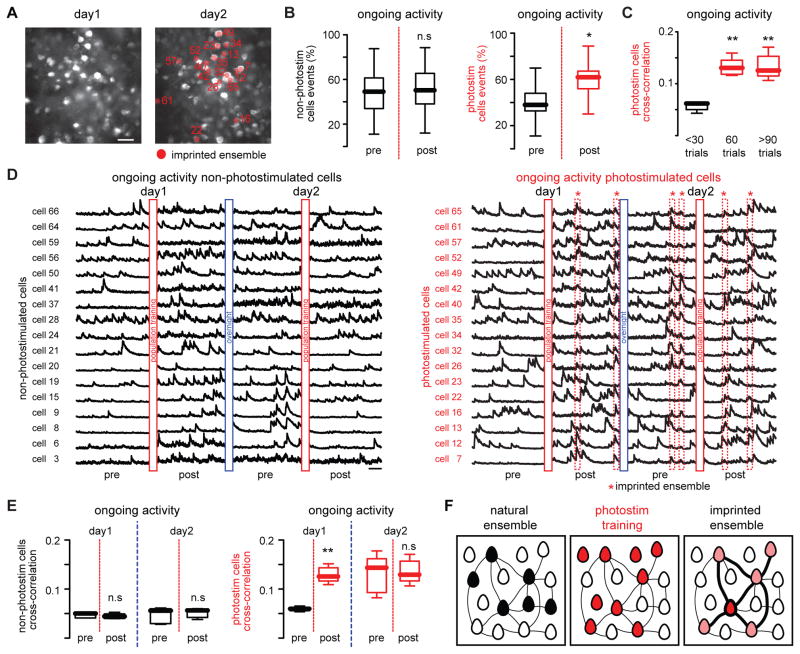
Neuronal ensembles are coactive groups of neurons that may represent building blocks of cortical circuits. These ensembles could be formed by Hebbian plasticity, whereby synapses between coactive neurons are strengthened. Here we report that repetitive activation with two-photon optogenetics of neuronal populations from ensembles in the visual cortex of awake mice builds neuronal ensembles that recur spontaneously after being imprinted and do not disrupt preexisting ones. Moreover, imprinted ensembles can be recalled by single- cell stimulation and remain coactive on consecutive days. Our results demonstrate the persistent reconfiguration of cortical circuits by two-photon optogenetics into neuronal ensembles that can perform pattern completion.


Figures

Fig. 1
Fig. 1. Two-photon optogenetic photostimulation reliably activates specific neuronal populations
(A), Simultaneous two-photon imaging and two-photon optogenetic photostimulation was performed in layer 2/3 over left primary visual cortex (V1) in awake head fixed mice through a reinforced thinned skull window. (B) Automatic contour detection of cortical neurons. Red cells denote neurons that reliably respond to optogenetic population photostimulation. Scale bar 50 μm. (C) Calcium transients of neurons activated by population photostimulation (red) and neurons activated indirectly (black). (D) Calcium transients from directly photostimulated neurons differed from calcium transients evoked indirectly by circuit activation. (E) Indirectly activated neurons represent a small percentage of the population (n = 6 mice; ***P = 0.0006; Mann-Whitney test). Data presented as whisker box plots displaying median and interquartile ranges.
Fig. 2
Fig. 2. Population photostimulation generates artificial cortical ensembles
(A) Principal component analysis (PCA) of population vectors evoked by visual stimuli (black) and optogenetic photostimulation (red). (B) Similarity map representing the angle between population vectors during visual stimuli (black) or population photostimuli (red). (C) Population similarity between visually and photostimulated evoked activity (n = 6 mice; ****P < 0.0001). (D) Time course activation of evoked cortical ensembles (top) aligned with raster plots representing the activity of visually evoked ensembles and photoensemble (middle) and calcium transients (bottom) of the most representative neurons of each ensemble. Colored boxes indicate ensemble label. (E) The total number of ensembles remained stable in both conditions (top; n = 6 mice; n.s P=0.4315). The number of cells defining photoensembles is significantly higher than neurons defining each visually evoked ensemble (bottom, n = 6 mice; *P = 0.0446). (F) Spatial maps of cortical ensembles in both experimental conditions. Scale bar 50 μm. (G) Distance between all neurons belonging to each ensemble (n = 6 mice; n.s. P = 0.3720). Data presented as whisker box plots displaying median and interquartile ranges analyzed using Mann-Whitney test.
Fig. 3
Fig. 3. Pattern completion of artificially imprinted ensembles
(A) PCA projection of population vectors during single cell photostimulation before and after population training. (B) Similarity map of population vectors from ongoing cortical activity. (C) Single cell photostimulation after population training recalled population vectors with high similarity (n = 6 mice; ****P < 0.0001). (D) Time course activation of cortical ensembles (top) aligned with raster plot of all the cells that belong to recalled ensemble (middle) and calcium transients (bottom) of representative neurons from recalled ensemble (red labels) before and after population training. (E) The number of ensembles before and after population training remains stable (top; n = 6 mice; n.s. P = 0.2259). After population training single cell photostimulation consistently recruits a group of neurons significantly larger than control conditions (bottom; n = 6 mice; ****P < 0.0001). (F) Spatial maps of neurons recruited by single cell photostimulation before (left) during (middle) and after population training (right). Arrow indicates stimulated neuron. Scale bar 50 μm. (G) After population training the distance from the target cell and activated neurons is increased (n = 6 mice; **** P < 0.0001). Data presented as whisker box plots displaying median and interquartile ranges analyzed using Mann-Whitney test.
Fig. 4
Fig. 4. Imprinted ensembles persist after consecutive days
(A) Images showing the same optical field at two different days. Scale bar 50 μm. (B) Percentage of events during ongoing activity of non-photostimulated cells remains stable (left; n = 5 mice; n.s P=0.5664; Wilcoxon matched-pairs signed rank test) whereas photostimulated cells increased their activity (right; n = 5 mice; *P = 0.0147; Wilcoxon matched-pairs signed rank test) after population training. Red line denotes population training. (C) The enhancement of cross-correlation between photostimulated cells depends on the number of training trials (n = 5 mice; **P = 0.0092; Kruskal-Wallis test). (D) Calcium transients of non-photostimulated neurons (left) and photostimulated neurons (right) during ongoing cortical activity at two different days before and after population training. Imprinted ensembles recur spontaneously at consecutive days (dotted red boxes). (E) Cross-correlation between non-photostimulated neurons (left; n = 5 mice; day 1: n.s. P = 0.5476; day 2: n.s. P = 0.8413; Mann-Whitney test) and photostimulated neurons (right; n = 5 mice; day 1: **P = 0.079; day 2: n.s. P = 1; Mann-Whitney test) during ongoing activity at consecutive days. (F) Population photostimulation enhances the functional connectivity between responsive neurons. Lines widths represent the strength of the functional connectivity between neurons. Data presented as whisker box plots displaying median and interquartile ranges.

References

    1. Kampa BM, Roth MM, Gobel W, Helmchen F. Representation of visual scenes by local neuronal populations in layer 2/3 of mouse visual cortex. Frontiers in neural circuits. 2011;5:18. - PMC - PubMed
    1. Ohki K, Chung S, Ch’ng YH, Kara P, Reid RC. Functional imaging with cellular resolution reveals precise micro-architecture in visual cortex. Nature. 2005;433:597–603. - PubMed
    1. Sawinski J, et al. Visually evoked activity in cortical cells imaged in freely moving animals. Proceedings of the National Academy of Sciences of the United States of America. 2009;106:19557–19562. - PMC - PubMed
    1. Churchland MM, et al. Neural population dynamics during reaching. Nature. 2012;487:51–56. - PMC - PubMed
    1. Peters AJ, Chen SX, Komiyama T. Emergence of reproducible spatiotemporal activity during motor learning. Nature. 2014;510:263–267. - PubMed

Publication types