. 2016:2016:6579463.
doi: 10.1155/2016/6579463. Epub 2016 Jul 19.

Mesenchymal Stromal Cells from Osteoarthritic Synovium Are a Distinct Population Compared to Their Bone-Marrow Counterparts regarding Surface Marker Distribution and Immunomodulation of Allogeneic CD4+ T-Cell Cultures

Affiliations

Mesenchymal Stromal Cells from Osteoarthritic Synovium Are a Distinct Population Compared to Their Bone-Marrow Counterparts regarding Surface Marker Distribution and Immunomodulation of Allogeneic CD4+ T-Cell Cultures

Sebastien Hagmann et al. Stem Cells Int. 2016.

Abstract

Introduction. The participation of an inflammatory joint milieu has been described in osteoarthritis (OA) pathogenesis. Mesenchymal stromal cells (MSCs) play an important role in modulating inflammatory processes. Based on previous studies in an allogeneic T-cell coculture model, we aimed at further determining the role of synovial MSCs in OA pathogenesis. Methods. Bone-marrow (BM) and synovial membrane (SM) MSCs from hip joints of late stage OA patients and CD4+ T-cells from healthy donors were analysed regarding surface marker expression before and after coculture. Proliferation upon CD3/CD28 stimulation and cytokine analyses were compared between MSCs. Results. SM-MSCs differed from BM-MSCs in several surface markers and their osteogenic differentiation potential. Cocultures of both MSCs with CD4+ T-cells resulted in recruitment of CD45RA+ FoxP3+ regulatory T-cells. Upon stimulation, only SM-MSCs suppressed CD4+ T-cell proliferation, while both SM-MSCs and BM-MSCs modified cytokine profiles through suppressing IL-2 and TNF-α as well as increasing IL-6 secretion. Conclusions. Synovial MSCs from OA joints are a unique fraction that can be distinguished from their bone-marrow derived counterparts. Their unique ability to suppress CD3/CD28 induced CD4+ T-cell proliferation makes them a potential target for future therapeutic approaches.


Figures
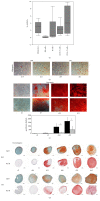
Figure 1
Figure 1
Mononuclear cell infiltration in the synovial membrane and MSC differentiation results. (a) The boxplot diagram displays the percentages of positive cells for the mononuclear cell fraction, CD14+ monocytes, CD16+CD56+ NK cells, CD4+ and CD8+ T-cells, and B-cells in the synovial membrane of 10 patients enclosed in the study. (b–d) Differentiation into the three lineages was successful in all MSCs (n = 5 patients per assay), while important donor-dependent variations were observed. (b) The figure shows representative results of adipogenic differentiation at d14 and d21 as defined by Oil Red O-stained lipid vacuoles. (c) Osteogenic differentiation was determined by calcium deposition through Alizarin Red staining (quantitative analysis of the reextracted dye is depicted in the diagram) and was enhanced in BM-MSCs compared to SM-MSCs. (d) Chondrogenic differentiation was assessed by Safranin O and Collagen II staining. refers to significant differences between the groups (p < 0.05).
Figure 2
Figure 2
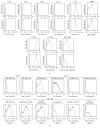
Surface marker expression on SM-MSCs and BM-MSCs. (a) Representative histograms of surface marker expression on SM-MSCs and BM-MSCs as detected by flow cytometry before coculture or monoculture. Red: background fluorescence; green: surface marker. (b) Marked differences between the groups were observed for CD19, CD146, and HLA-DR, as shown by representative histograms. See Table 1 for means and standard deviation.
Figure 3
Figure 3
Surface marker expression on CD4+ T-cells in monocultures and MSC-cocultures. (a) The diagrams display the mean positive cells for CD4+CD25+FoxP3+, CD4+CD25+CD127-, CD45R0+ Tregs, and CD45RA+ Tregs as detected by flow cytometry (n = 10). ∗∗ p < 0.01 and ∗∗∗ p < 0.001. (b) Representative flow cytometry plots for background fluorescence, CD4+ T-cell monocultures at day 0 and day 5, and the respective BM-MSC and SM-MSC cocultures at day 5. Lymphocytes were gated for CD4, CD25, and FoxP3.
Figure 4
Figure 4
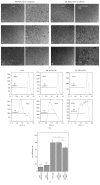
Evaluation of MSC/CD4+ T-cell interaction upon T-cell stimulation. (a) Representative photographs at d2, d4, and d5 of coculture for bone-marrow (BM) and synovial membrane (SM) derived MSCs are displayed. Index: 100 μm. (b) Representative histograms from one CFSE assay (total triplicate assays n = 5) for unstimulated CD4+ T-cells, unstimulated CD4+BM-MSC and SM-MSC cocultures, and the respective CD3/CD28 stimulated cultures. (c) The histogram displays the mean percentage of proliferated cells in five triplicate CFSE assays (see Methods for gating). p < 0.05 and ∗∗∗ p < 0.001.
Figure 5
Figure 5
Cytokine levels in CD3/CD28- stimulated and control CD4+ T-cells and the respective MSC cocultures. CD3/CD28 stimulation resulted in an increase of IL-2, IL-4, IL-6, IL-10, IL-17a, TNF-α, and IFN-γ secretion. While for IL-2 and TNF-α cocultivation with MSCs resulted in a significant decrease in CD4+ T-cell cytokine secretion, a significant increase in IL-6 secretion in unstimulated and stimulated cocultures could be observed. Due to the high IL-6 levels in the stimulated cocultures, this diagram is displayed with a logarithmic y-scale. p < 0.05, ∗∗ p < 0.01, ∗∗∗ p < 0.001.

References

    1. Lawrence R. C., Felson D. T., Helmick C. G., et al. Estimates of the prevalence of arthritis and other rheumatic conditions in the United States. Part II. Arthritis and Rheumatism. 2008;58(1):26–35. doi: 10.1002/art.23176. - DOI - PMC - PubMed
    1. Hunter D. J., Felson D. T. Osteoarthritis. The British Medical Journal. 2006;332(7542):639–642. doi: 10.1136/bmj.332.7542.639. - DOI - PMC - PubMed
    1. Kurtz S., Mowat F., Ong K., Chan N., Lau E., Halpern M. Prevalence of primary and revision total hip and knee arthroplasty in the United States from 1990 through 2002. The Journal of Bone and Joint Surgery—Series A. 2005;87(7):1487–1497. doi: 10.2106/jbjs.d.02441. - DOI - PubMed
    1. Goldring M. B., Otero M. Inflammation in osteoarthritis. Current Opinion in Rheumatology. 2011;23(5):471–478. doi: 10.1097/BOR.0b013e328349c2b1. - DOI - PMC - PubMed
    1. Sellam J., Berenbaum F. The role of synovitis in pathophysiology and clinical symptoms of osteoarthritis. Nature Reviews Rheumatology. 2010;6(11):625–635. doi: 10.1038/nrrheum.2010.159. - DOI - PubMed

LinkOut - more resources