. 2016:2016:9131284.
doi: 10.1155/2016/9131284. Epub 2016 Jul 19.

The Habituation/Cross-Habituation Test Revisited: Guidance from Sniffing and Video Tracking

Affiliations

The Habituation/Cross-Habituation Test Revisited: Guidance from Sniffing and Video Tracking

G Coronas-Samano et al. Neural Plast. 2016.

Abstract

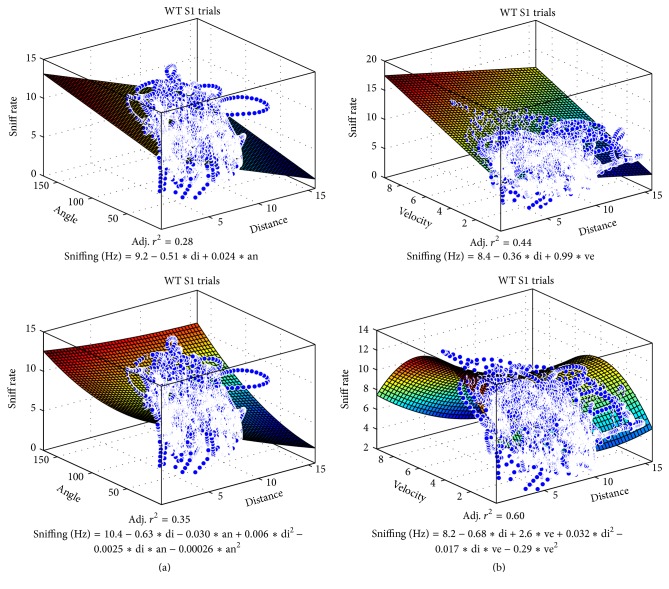
The habituation/cross-habituation test (HaXha) is a spontaneous odor discrimination task that has been used for many decades to evaluate olfactory function in animals. Animals are presented repeatedly with the same odorant after which a new odorant is introduced. The time the animal explores the odor object is measured. An animal is considered to cross-habituate during the novel stimulus trial when the exploration time is higher than the prior trial and indicates the degree of olfactory patency. On the other hand, habituation across the repeated trials involves decreased exploration time and is related to memory patency, especially at long intervals. Classically exploration is timed using a stopwatch when the animal is within 2 cm of the object and aimed toward it. These criteria are intuitive, but it is unclear how they relate to olfactory exploration, that is, sniffing. We used video tracking combined with plethysmography to improve accuracy, avoid observer bias, and propose more robust criteria for exploratory scoring when sniff measures are not available. We also demonstrate that sniff rate combined with proximity is the most direct measure of odorant exploration and provide a robust and sensitive criterion.


Figures

Figure 1
Figure 1
The sniff rate increases during cross-habituation in female wild type (WT) mice. A cotton tip odorized with phenyl ethanol (PE) or mouse urine as social odor (S) was presented 3 times during the habituation/cross-habituation test (HaXha). PE3 represents the 3rd presentation of PE and S1 the 1st presentation of S. The time exploring the odorant (OnTime) by WT mice (129 strain, n = 7) was scored in real-time by Noldus video tracking system based on the standard criteria of nose proximity (<2 cm) and head orientation (<20°) to the odor source. The simultaneously plethysmographically measured sniff rate was measuring while exploring (OnFreq) and not exploring (OffFreq), as was the sniff amplitude (PeakMax_on and PeakMax_off, resp.). Increased exploration time during S1 shows cross-habituation and was accompanied by an increase in the sniff rate. OnFreq and OffFreq: sniff rate (Hz); PeakMax_on and PeakMax_off: sniff peak amplitude (standard deviations of z-scored pressure signal). OnTime: odor object exploration time (s). All data are mean ± SEM.
Figure 2
Figure 2
The sniff rate increases during cross-habituation in female FUS ko mice. The same as Figure 1, but now for FUS knock-out (ko) mice (n = 13), which have chronic oxidative stress and are a new model of accelerated aging. OnFreq and OffFreq: sniff rate (Hz); PeakMax_on and PeakMax_off: sniff peak amplitude (standard deviations of z-scored pressure signal). OnTime: odor object exploration time (s). All data are mean ± SEM.
Figure 3
Figure 3
HaXha maps show sniffing rate related to proximity and orientation. Two S1 cross-habituation trials (first presentation of social odor) are represented by plotting the x and y nose location (circle), orientation (circle size), and sniff rate (circle color, see color bar legend, Hz) of each WT mouse during each 100 ms bin of the 120 sec trial. Subsequent bins are connected with lines. Centrally located (x, y = 0, 0) bulls-eye indicates the odor source location and 2 cm proximity criterion (2 cm radius). Large solid circle marks the position at trial start and the small circle the position at the end. Mice tended to sniff faster (more red circles) when closer to and oriented to (smaller circles) the odorant.
Figure 4
Figure 4
Proximity and velocity are correlated with S1 trial sniff rate in WT mice. On each trial (PE3, S3) for each WT mouse (n = 7) the mouse nose proximity (Distance r) and head orientation (Angle r) to the odor source and the velocity of the mice were regressed onto the sniff rate. Distance was negatively correlated during S1 trials, whereas velocity consistently positively correlated with sniff rate. The relation with angle was inconsistent.
Figure 5
Figure 5
Proximity, orientation, and velocity are correlated with S1 trial sniff rate in FUS KO mice. The same as Figure 4, but for FUS KO mice (n = 13), showing similar results but with stronger negative correlation between head angle and sniff rate during S1 trials. Again, velocity consistently positively correlated with sniff rate.
Figure 6
Figure 6
Sniff rate quartiles discriminate S1 proximity and consistently reveal WT mouse velocity. We explored how behavior varied as a function of sniff rate. For each trial type (PE3, S3) the 100 ms time bins were assigned to one of four quartiles of WT (n = 7) sniff rates (0th–25th, 25th–50th, 50th–75th, and 75th–100th percentile, (a)). Their associated nose distance (b) and head angle (c) to the odor source, as well as their velocity (d), were determined. Distance and to some extent head angle to the object were lower for the S1 trial during the high sniff rate top quartile time bins. Velocity consistently increased with increasing sniff rates across all trial types. FUS mice showed similar patterns (not shown).
Figure 7
Figure 7
Sniff rate quartiles discriminate exploration time based on the proximity criterion. The same as Figure 6, but here the fraction of time the mouse spent sniffing at each quartile's sniff rate while fulfilling the <2 cm nose proximity criterion (left), the <20° head orientation criterion (middle) or both criteria was determined. WT mice (n = 7) were in close proximity to the odor for 30% of the time they sniffed fast (dist_ON_75) during S1 trials but 13% or less during other trial types (i.e., 87% or more of the time they sniffed at high rate they were >2 cm from the odorant during PE3, S2, or S3). For orientation the results were not as trial type specific or sniff rate specific (especially S2 at angle_ON_25: 44% of time oriented to odor during slow (lowest quartile) sniff rates). The orientation criterion does not appear to add to the exploration time fraction as determined by nose proximity (dist_ON), as explore_ON is quite similar to dist_ON. FUS KO mice showed similar results (not shown).
Figure 8
Figure 8
Distance and velocity combined predict sniff rates. Population vectors that include all time bins from all WT mice were used to regress both nose to odor source distance and head angle to odor source (dist-angle) or distance and velocity (dist-veloc) parametrically onto sniff rates using 1st- or 2nd-order equations (shown in Figure 9), for either all trials of WT or FUS KO mice or their S1 trials. The 2nd-order distance-velocity regression explained 43–60% of sniff rates (adjusted r 2; S1: n = 7 mice 1201 time bins = 8407 bins; all: n = 7 mice 1201 bins 4 trials = 33,628 time bins). A 3-way stepwise 1st-order multiple regression (dist-angle-veloc 1st, right) also robustly explained sniff rates.
Figure 9
Figure 9
Distance and velocity combined predict sniff rates. Plots of the population vector sniff rates in state-space ((a) distance and angle; (b) velocity and distance) used in Figure 8 and the multiple regression equations and adjusted r 2 for all WT S1 trials combined (8407 time bins).
Figure 10
Figure 10
Exploration times at targeted criterion thresholds. Top: exploration time (as fraction of total trial time) was established for nose to odor source distance (d, <1, <2, <4, and <8 cm), head angle to odor source (a, <5, <10, <20, and <40°), and velocity (v, >4, >2, >1, and >0.5 cm/s) criteria at four threshold levels using population vectors (top) for S1 trials in WT mice (n = 7). Marked () is d2 (distance < 2 cm) as standard criterion reference, yielding 11% (13.2 sec) exploration time. Relaxed criteria yield higher exploration times. Bottom: the effects of head angle and velocity criteria, separately (a5–a40, v4–v0.5) or combined (a5–a40 combined with v0.5) on exploration time using a nose to odor source distance <1, <2, or <4 cm (d1–d4) as additional criterion in each graph. Marked (, black) is the combined criterion a < 20° and d < 2 cm, being the commonly used “standard” criterion, which did not restrict the exploration time over criterion d < 2 cm alone (d2, Top). Also marked (, red) is the combination d < 4 cm and v > 0.5 cm (d4-v0.5), suggested as useful new criterion (see Results and Figure 11) that yielded 15% exploration time.
Figure 11
Figure 11
Sniffing rates at targeted criterion thresholds. Sniff rates associated with the same criteria as shown in Figure 10. Top: single criteria; Bottom: combined criteria. Relaxed criterion thresholds include bins with low sniff rates unrelated to odor source exploration. Stricter orientation criteria combined with distance <1 cm or <2 cm do not yield higher sniff rates during exploration (bottom left), but exploration time drops dramatically (Figure 10, bottom left). The relaxed proximity criterion (<4 cm) combined with velocity >0.5 cm/s (, red) yields sniff rates equivalent to the standard (d2-a10; 9.6 Hz; bottom center) and also increases exploration time from 11% to 15% (Figure 10), suggesting this to be a useful new HaXha odor exploration criterion. Similar results were found for other trial types and FUS KO mice (not shown).
Figure 12
Figure 12
New combined proximity-velocity criterion improves HaXha exploration scoring in WT mice. To test the usefulness of the exploration criterion of the velocity >0.5 cm/s and distance <4 cm, the trials were scored accordingly (center) for sniff rate (Hz) when exploring (sniff_ON_di4Xve05) or not (sniff_OFF_di4Xve05) and exploration time (s; explore_ON_di4Xve05). The results of the standard criterion (d < 2 cm and angle < 20°) are shown on the left (same as Figure 1, left). Data were more robust upon removing sniff rates of mice with exploration time <1 sec (_B extension). The new criterion increased S1 exploration time (orange line) and decreased S2 and S3 exploration time variance (arrows), while retaining high sniff rates indicative of sniff-guided odorant exploration, leading to stronger statistical conclusions. The difference (%) in time bins meeting these two criteria was also assessed (% overlap; crit_diffpct_div4ve05) as well as between the Noldus distance-angle exploration marker output and the thresholded smoothed distance-angle score (crit_diffpct). P < 0.05; + P < 0.01; # P < 0.001 (paired 1-sided t-test versus S1).
Figure 13
Figure 13
New combined proximity-velocity criterion improves HaXha exploration scoring in FUS KO mice. The same as Figure 12, but for FUS KO mice (n = 13). The new criterion increased S1, S2, and S3 exploration time (orange lines), while retaining high sniff rates indicative of sniff-guided odorant exploration. + P < 0.01 (paired 1-sided t-test versus S1).
Figure 14
Figure 14
New combined proximity-sniffing criterion improves HaXha exploration scoring in mice. To demonstrate the usefulness of using sniff rate itself as an exploration criterion for WT (left, n = 7) and FUS KO (right, n = 13) mice, bins were scored using sniff rate >8.2 Hz (the 97.5th percentile of sniff_OFFdi4Xsniff, i.e., unusually high sniff rates when mice are not exploring) and distance <4 cm. Sniff rate (Hz) when exploring (sniff_ON_di4Xsniff) and not exploring (sniff_OFF_di4Xsniff) and exploration time (s; explore_ON_di4Xsniff) are shown. The difference (%) in time bins meeting this new and the standard criterion was also assessed (% overlap; crit_diffpct_div4sniff). + P < 0.01 (paired 1-sided t-test versus S1).

Similar articles

Cited by

References

    1. Thompson R. F., Spencer W. A. Habituation: a model phenomenon for the study of neuronal substrates of behavior. Psychological Review. 1966;73(1):16–43. doi: 10.1037/h0022681. - DOI - PubMed
    1. Rankin C. H., Abrams T., Barry R. J., et al. Habituation revisited: an updated and revised description of the behavioral characteristics of habituation. Neurobiology of Learning and Memory. 2009;92(2):135–138. doi: 10.1016/j.nlm.2008.09.012. - DOI - PMC - PubMed
    1. Sundberg H., Døving K., Novikov S., Ursin H. A method for studying responses and habituation to odors in rats. Behavioral and Neural Biology. 1982;34(1):113–119. doi: 10.1016/S0163-1047(82)91501-1. - DOI - PubMed
    1. Beauchamp G. K., Wellington J. L. Habituation to individual odors occurs following brief, widely-spaced presentations. Physiology and Behavior. 1984;32(3):511–514. doi: 10.1016/0031-9384(84)90272-5. - DOI - PubMed
    1. Brown R. E. Individual odors of rats are discriminable independently of changes in gonadal hormone levels. Physiology and Behavior. 1988;43(3):359–363. doi: 10.1016/0031-9384(88)90199-0. - DOI - PubMed

Publication types

LinkOut - more resources