

Co-expression analysis identifies long noncoding RNA SNHG1 as a novel predictor for event-free survival in neuroblastoma
- PMID: 27517149
- PMCID: PMC5295409
- DOI: 10.18632/oncotarget.11158
Co-expression analysis identifies long noncoding RNA SNHG1 as a novel predictor for event-free survival in neuroblastoma
Abstract
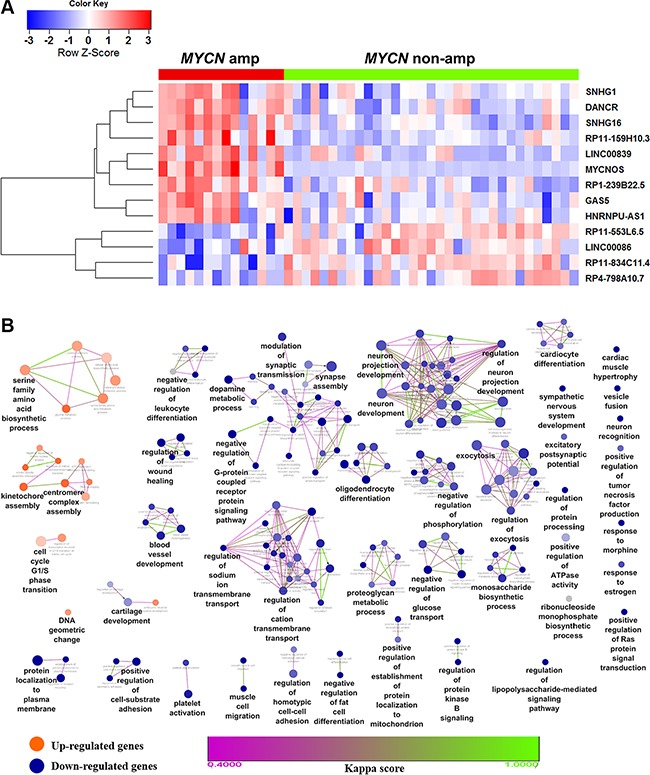
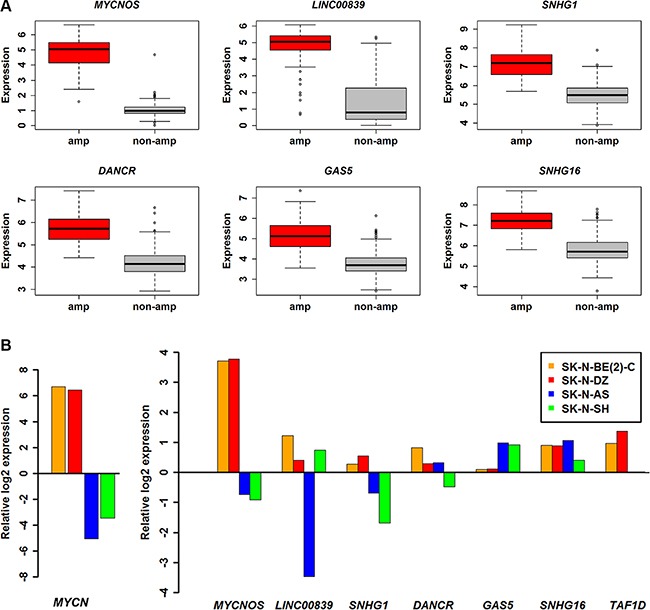
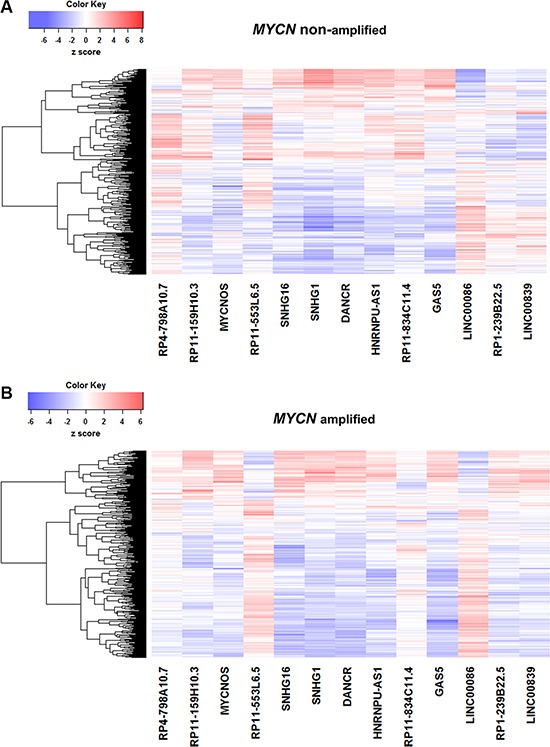
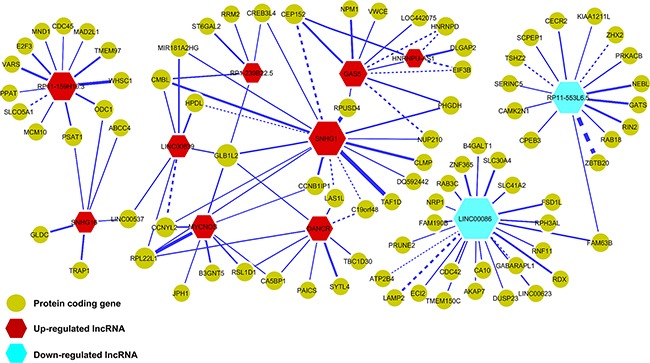
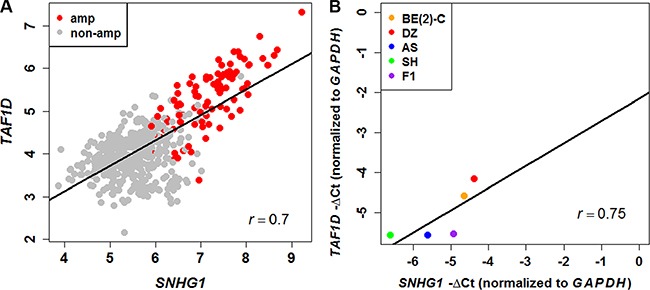
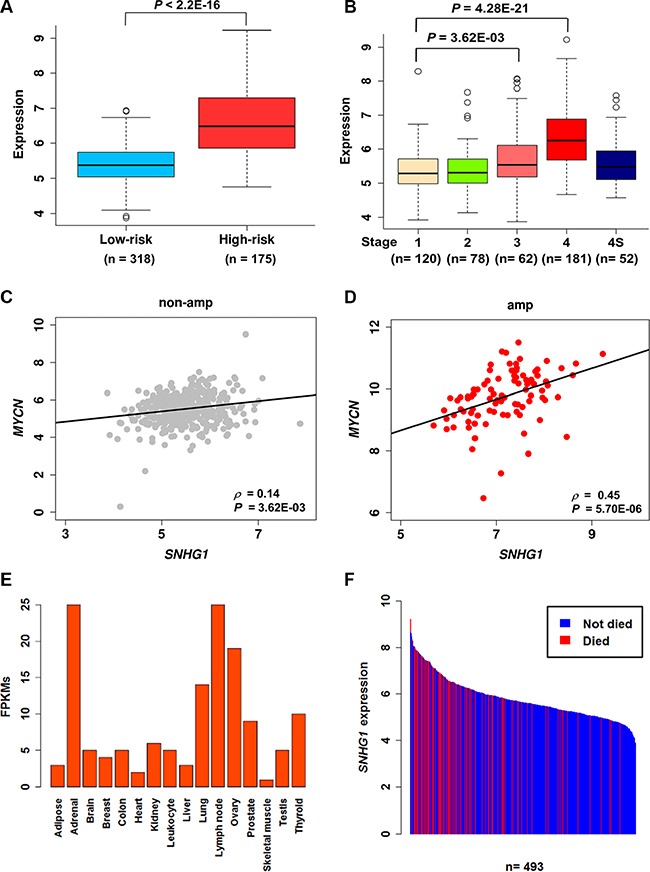
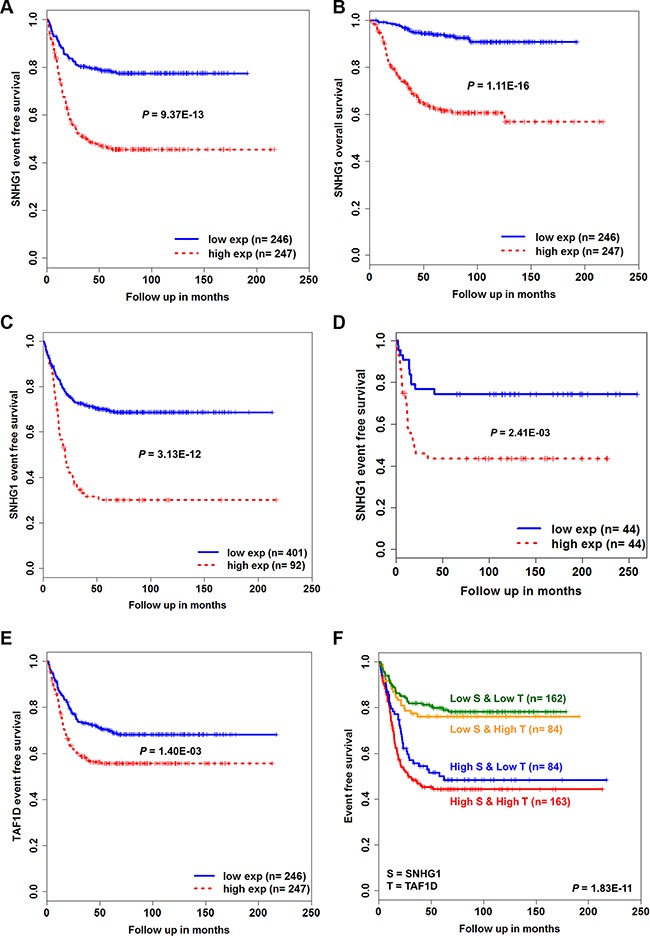
Despite of the discovery of protein therapeutic targets and advancement in multimodal therapy, the survival chance of high-risk neuroblastoma (NB) patients is still less than 50%. MYCN amplification is a potent driver of NB, which exerts its oncogenic activity through either activating or inhibiting the transcription of target genes. Recently, long noncoding RNAs (lncRNAs) are reported to be altered in cancers including NB. However, lncRNAs that are altered by MYCN amplification and associated with outcome in high-risk NB patients are limitedly discovered. Herein, we examined the expression profiles of lncRNAs and protein-coding genes between MYCN amplified and MYCN non-amplified NB from microarray (n = 47) and RNA-seq datasets (n = 493). We identified 6 lncRNAs in common that were differentially expressed (adjusted P ≤ 0.05 and fold change ≥ 2) and subsequently validated by RT-qPCR. The co-expression analysis reveals lncRNA, SNHG1 and coding gene, TAF1D highly co-expressed in NB. Kaplan-Meier analysis shows that higher expression of SNHG1 is significantly associated with poor patient survival. Importantly, multivariate analysis confirms high expression of SNHG1 as an independent prognostic marker for event-free survival (EFS) (HR = 1.58, P = 2.36E-02). In conclusion, our study unveils that SNHG1 is up-regulated by MYCN amplification and could be a potential prognostic biomarker for high-risk NB intervention.
Keywords: SNHG1; co-expression study; event-free survival; long noncoding RNAs; neuroblastoma.
Conflict of interest statement
The authors declare no conflicts of interest.
Figures
Similar articles
-
Identification of prognostic long noncoding RNAs associated with spontaneous regression of neuroblastoma.Cancer Med. 2020 Jun;9(11):3800-3815. doi: 10.1002/cam4.3022. Epub 2020 Mar 26. Cancer Med. 2020. PMID: 32216054 Free PMC article.
-
LncRNA SNHG1 regulates neuroblastoma cell fate via interactions with HDAC1/2.Cell Death Dis. 2022 Sep 21;13(9):809. doi: 10.1038/s41419-022-05256-z. Cell Death Dis. 2022. PMID: 36130928 Free PMC article.
-
A MYCN-amplified cell line derived from a long-term event-free survivor among our sixteen established neuroblastoma cell lines.Cancer Lett. 2013 Apr 30;331(1):115-21. doi: 10.1016/j.canlet.2012.12.011. Epub 2012 Dec 23. Cancer Lett. 2013. PMID: 23268333
-
Long noncoding RNAs and neuroblastoma.Oncotarget. 2015 Jul 30;6(21):18265-75. doi: 10.18632/oncotarget.4251. Oncotarget. 2015. PMID: 26087192 Free PMC article. Review.
-
Long non-coding SNHG1 in cancer.Clin Chim Acta. 2019 Jul;494:38-47. doi: 10.1016/j.cca.2019.03.002. Epub 2019 Mar 6. Clin Chim Acta. 2019. PMID: 30849309 Review.
Cited by
-
The prognostic value of lncRNA SNHG1 in cancer patients: a meta-analysis.BMC Cancer. 2019 Aug 7;19(1):780. doi: 10.1186/s12885-019-5987-4. BMC Cancer. 2019. PMID: 31391030 Free PMC article.
-
Human Long Noncoding RNA Regulation of Stem Cell Potency and Differentiation.Stem Cells Int. 2017;2017:6374504. doi: 10.1155/2017/6374504. Epub 2017 Aug 30. Stem Cells Int. 2017. PMID: 28951743 Free PMC article. Review.
-
PD-L1, inflammation, non-coding RNAs, and neuroblastoma: Immuno-oncology perspective.Semin Cancer Biol. 2018 Oct;52(Pt 2):53-65. doi: 10.1016/j.semcancer.2017.11.009. Epub 2017 Nov 28. Semin Cancer Biol. 2018. PMID: 29196189 Free PMC article. Review.
-
Overexpression of LncRNA SNHG1 Were Suitable for Oncolytic Adenoviruse H101 Therapy in Oral Squamous-Cell Carcinoma.Onco Targets Ther. 2020 Dec 21;13:13033-13039. doi: 10.2147/OTT.S285536. eCollection 2020. Onco Targets Ther. 2020. PMID: 33376352 Free PMC article.
-
Upregulated lncRNA SNHG1 contributes to progression of non-small cell lung cancer through inhibition of miR-101-3p and activation of Wnt/β-catenin signaling pathway.Oncotarget. 2017 Mar 14;8(11):17785-17794. doi: 10.18632/oncotarget.14854. Oncotarget. 2017. PMID: 28147312 Free PMC article.
References
-
- Maris JM, Hogarty MD, Bagatell R, Cohn SL. Neuroblastoma. Lancet. 2007;369:2106–20. - PubMed
-
- Brodeur GM. Neuroblastoma: biological insights into a clinical enigma. Nat Rev Cancer. 2003;3:203–16. - PubMed
-
- Matthay KK, Villablanca JG, Seeger RC, Stram DO, Harris RE, Ramsay NK, Swift P, Shimada H, Black CT, Brodeur GM, Gerbing RB, Reynolds CP. Treatment of High-Risk Neuroblastoma with Intensive Chemotherapy Radiotherapy Autologous Bone Marrow Transplantation and 13-cis-Retinoic Acid. N Engl J Med. 1999;341:1165–73. - PubMed
Publication types
MeSH terms
Substances
LinkOut - more resources
Full Text Sources
Other Literature Sources
Medical
