

Surgical Site Infections: Volume-Outcome Relationship and Year-to-Year Stability of Performance Rankings
- PMID: 27517331
- PMCID: PMC5145247
- DOI: 10.1097/MLR.0000000000000620
Surgical Site Infections: Volume-Outcome Relationship and Year-to-Year Stability of Performance Rankings
Abstract
Background: Surgical site infection (SSI) rates are publicly reported as quality metrics and increasingly used to determine financial reimbursement.
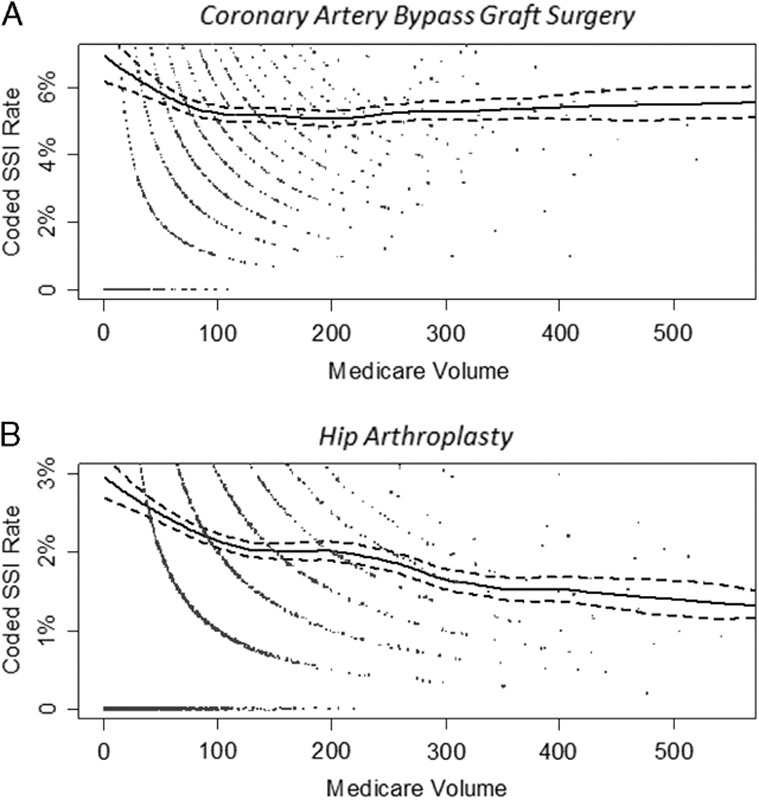
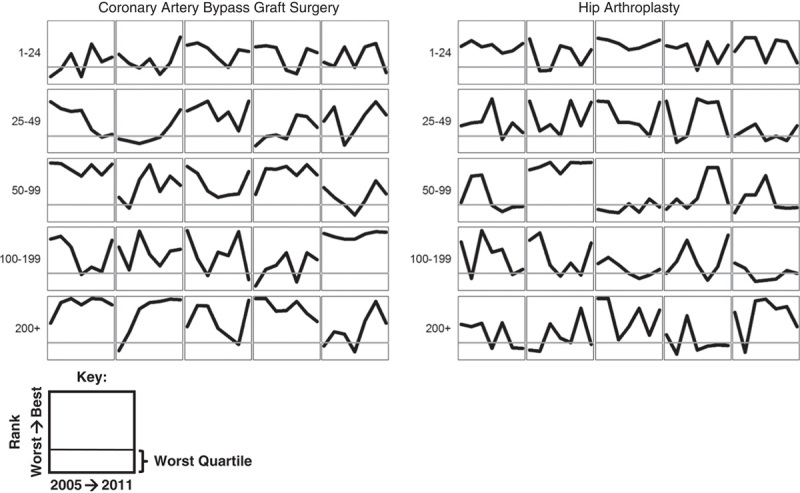
Objective: To evaluate the volume-outcome relationship as well as the year-to-year stability of performance rankings following coronary artery bypass graft (CABG) surgery and hip arthroplasty.
Research design: We performed a retrospective cohort study of Medicare beneficiaries who underwent CABG surgery or hip arthroplasty at US hospitals from 2005 to 2011, with outcomes analyzed through March 2012. Nationally validated claims-based surveillance methods were used to assess for SSI within 90 days of surgery. The relationship between procedure volume and SSI rate was assessed using logistic regression and generalized additive modeling. Year-to-year stability of SSI rates was evaluated using logistic regression to assess hospitals' movement in and out of performance rankings linked to financial penalties.
Results: Case-mix adjusted SSI risk based on claims was highest in hospitals performing <50 CABG/year and <200 hip arthroplasty/year compared with hospitals performing ≥200 procedures/year. At that same time, hospitals in the worst quartile in a given year based on claims had a low probability of remaining in that quartile the following year. This probability increased with volume, and when using 2 years' experience, but the highest probabilities were only 0.59 for CABG (95% confidence interval, 0.52-0.66) and 0.48 for hip arthroplasty (95% confidence interval, 0.42-0.55).
Conclusions: Aggregate SSI risk is highest in hospitals with low annual procedure volumes, yet these hospitals are currently excluded from quality reporting. Even for higher volume hospitals, year-to-year random variation makes past experience an unreliable estimator of current performance.
Conflict of interest statement
The authors declare no conflicts of interest.
Figures
References
-
- Department of Health and Human Services, Centers for Medicare & Medicaid Services. Medicare program; hospital inpatient prospective payment systems for acute care hospitals and the long-term care hospital prospective payment system and fiscal year 2015 rates; quality reporting requirements for specific providers; reasonable compensation equivalents for physician services in excluded hospitals and certain teaching hospitals; provider administrative appeals and judicial review; enforcement provisions for organ transplant centers; and electronic health record (EHR) incentive program. Final rule. Fed Register. 2014;79:49853–50536. Available at: www.gpo.gov/fdsys/pkg/FR-2014-08-22/pdf/2014-18545.pdf. - PubMed
-
- VanLare JM, Conway PH. Value-based purchasing—national programs to move from volume to value. N Engl J Med. 2012;367:292–295. - PubMed
-
- Blumenthal D, Jena AB. Hospital value-based purchasing. J Hosp Med. 2013;8:271–277. - PubMed
-
- Medicare.gov. Hospital compare. Available at: www.medicare.gov/hospitalcompare/search.html. Accessed May 24, 2016.
-
- Makary MA, Aswani MS, Ibrahim AM, et al. Variation in surgical site infection monitoring and reporting state. J Healthc Qual. 2013;35:41–46. - PubMed
MeSH terms
Grants and funding
LinkOut - more resources
Full Text Sources
Other Literature Sources
Medical
Miscellaneous
